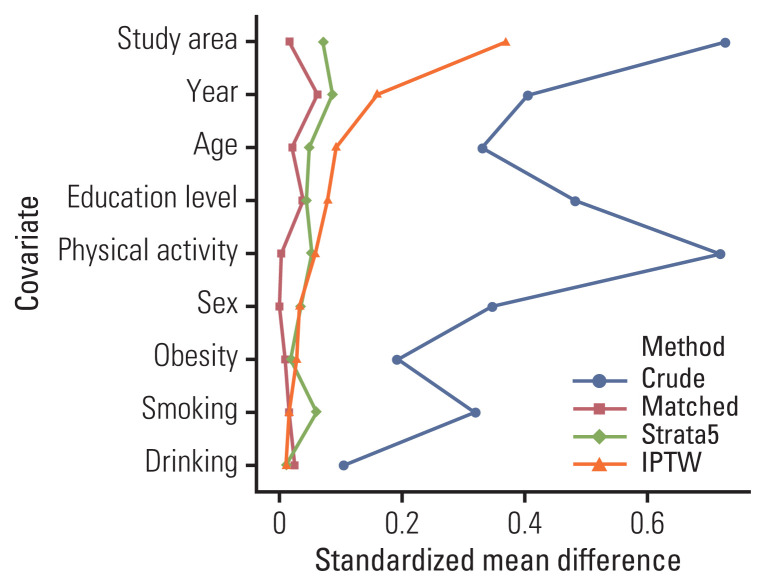
Fig. 2.
Comparison of the standardized mean differences by covariates with different propensity score-based methods according to occupational exposure to pesticides. Crude, whole dataset; Matched, 1:1 matched dataset; Strata5, dataset stratified into five strata; IPTW, inverse probability-of-treatment weighting dataset. This plot shows the standardized mean differences between study subjects who had been occupationally exposed to pesticides and those who had not; a value > 0.1 indicates the imbalance of a covariate.

