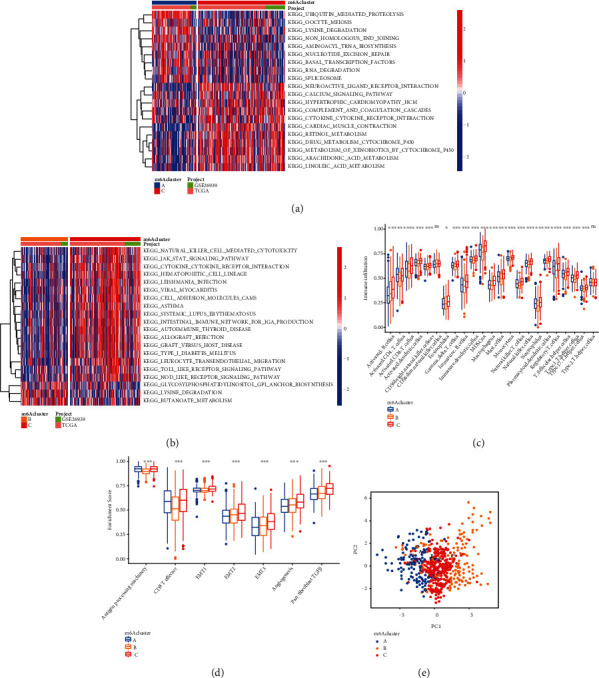
Figure 4.

GSVA enrichment analysis showing the activation states of biological pathways in distinct m6A modification patterns. The heat map was used to visualize these biological processes, and red represented activated pathways, and blue represented inhibited pathways. (a) m6A cluster A vs. m6A cluster C; (b) m6A cluster B vs. m6A cluster C; (c) the abundance of each TME infiltrating cell in three m6A modification patterns. The upper and lower ends of the boxes represented the interquartile range of values. The lines in the boxes represented median value, and dots showed outliers. The asterisks represented the statistical P value (∗P < 0.05; ∗∗P < 0.01; ∗∗∗P < 0.001). (d) Differences in stroma-activated pathways including EMT, TGF beta, and angiogenesis pathways among three distinct m6A modification patterns. The statistical differences among the three modification patterns were tested by the one-way ANOVA test. The asterisks represented the statistical P value (∗P < 0.05; ∗∗P < 0.01; ∗∗∗P < 0.001). (e) Principal component analysis for the transcriptome profiles of three m6A modification patterns, showing a remarkable difference in transcriptome between different modification patterns.
