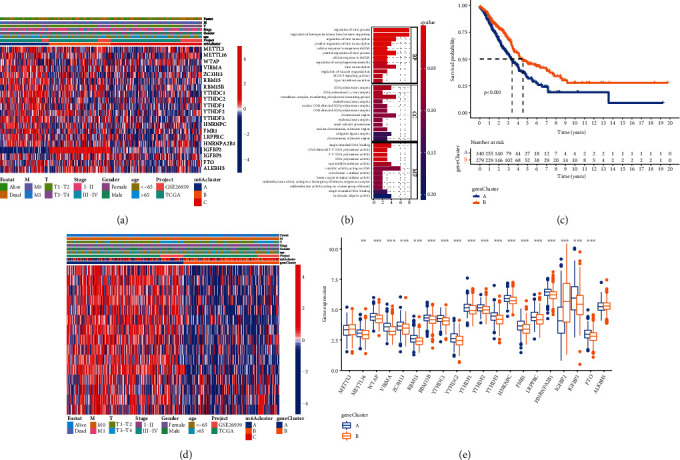
Figure 5.

(a) Unsupervised clustering of 23 m6A regulators in the LUAD cohort. The m6A cluster, M, T, gender, age, stage, and survival status were used as patient annotations. Red represented a high expression of regulators, and blue represented low expression. (b) Functional annotation for m6A-related genes using GO enrichment analysis. The color depth of the barplots represented the number of genes enriched. (c) Kaplan-Meier curves indicated m6A modification genomic phenotypes were markedly related to the overall survival of patients in the LUAD cohort (P < 0.001, log-rank test). (d) Unsupervised clustering of 23 m6A regulators in the LUAD cohort. The gene cluster, m6A cluster, M, T, gender, age, stage, and survival status were used as patient annotations. Red represented a high expression of regulators, and blue represented low expression. (e) The expression of 23 m6A regulators in two gene clusters. The upper and lower ends of the boxes represented an interquartile range of values. The lines in the boxes represented median value, and black dots showed outliers. The asterisks represented the statistical P value (∗P < 0.05; ∗∗P < 0.01; ∗∗∗P < 0.001).
