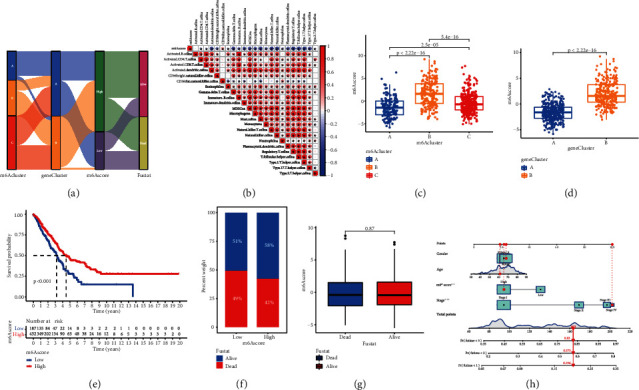
Figure 6.

Construction of m6A signatures. (a) Alluvial diagram showing the changes of m6A clusters, gene cluster, m6A score, and survival status. (b) Correlations between m6A score and the known gene signatures in LUAD cohort using Spearman analysis. A negative correlation was marked with blue and a positive correlation with red. (c) Differences in m6A score among three m6A modification patterns in LUAD cohort (P < 0.001, Kruskal-Wallis test). (d) Differences in m6A score between two gene clusters in LUAD cohort. The Wilcoxon rank-sum test was used to compare the statistical difference between two gene clusters (P < 0.001). (e) Survival analyses for m6A score based on 629 patients with LUAD from two cohorts. (f) The proportion of survival status in low or high m6A score groups. Survival status: 51%/49% in the low m6A score groups and 58%/42% in the high m6A score groups. (g) Differences in m6A score between dead and alive groups (P = 0.87, Wilcoxon test). (h) m6A score related nomogram, the asterisks represented the statistical P value (∗P < 0.05; ∗∗P < 0.01; ∗∗∗P < 0.001).
