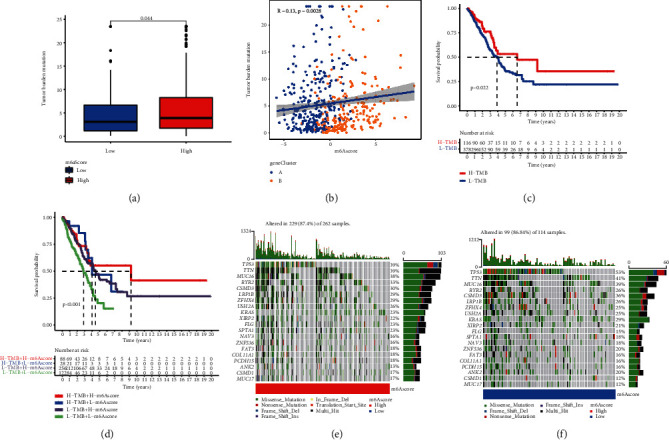
Figure 7.

(a) Difference in tumor burden mutation between two m6A score groups in the LUAD cohort. The Wilcoxon rank-sum test was used to compare the statistical difference between two gene clusters (P = 0.044). (b) Correlations between m6A score and tumor burden mutation using Spearman analysis (R = 0.13, P = 0.0028). (c) Survival analysis of the high (N = 116) and low (N = 378) TMB groups in the LUAD cohort. (d) Survival analysis of distinct groups stratified by both TMB and m6A score (P < 0.022). (e, f) The waterfall plot of tumor somatic mutation established by those with high m6A score (e) and low m6A score (f). Each column represented individual patients. The upper barplot showed TMB; the number on the right indicated the mutation frequency in each gene. The right barplot showed the proportion of each variant type.
