
Figure 8.
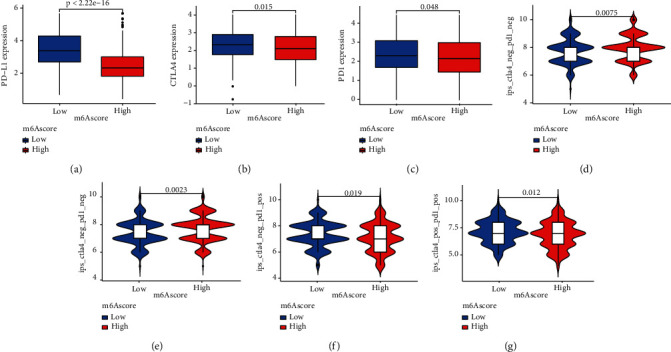
m6A modification patterns in the role of immunotherapy. (a) Differences in PD-L1 expression between low and high m6A score groups (P < 0.0001, Wilcoxon test). (b) Differences in CTLA4 expression between low and high m6A score groups (P = 0.015, Wilcoxon test). (c) Differences in PD1 expression between low and high m6A score groups (P = 0.048, Wilcoxon test). (d–g) Differences in immunotherapy effects between low and high m6A score groups (P < 0.05, Wilcoxon test).