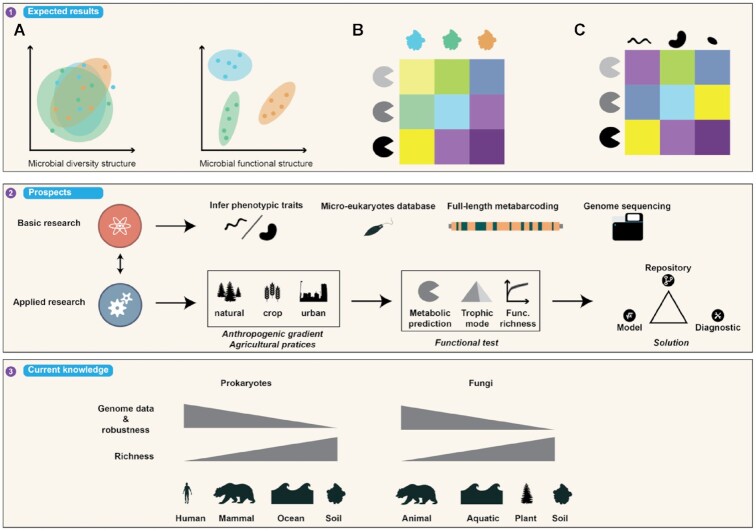
Figure 10:
Summary diagram of the expected results (first box), the functional prediction prospects (second box), and the limits of the microbial genomic data available for different habitats (third box). The first box illustrates a comparative example of data results of community structures and functional structures through a PCA (A). This example illustrates the case when the functional community structure differentiates experimental conditions better than it differentiates the microbial community structure. Illustrative heat maps showing the relative abundance of genes per sample (B) or per OTU (C).

