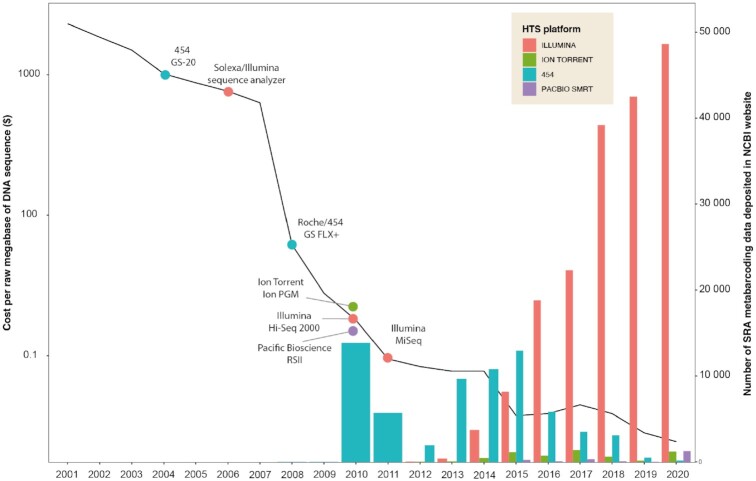
Figure 2:
Evolution of costs (dollars) per raw megabase of DNA sequence (black line with logarithmic scale), and evolution of the number of SRA metabarcoding data deposited in the NCBI website. The data used to draw this figure are described in Additional File 1, section Figure 2.

