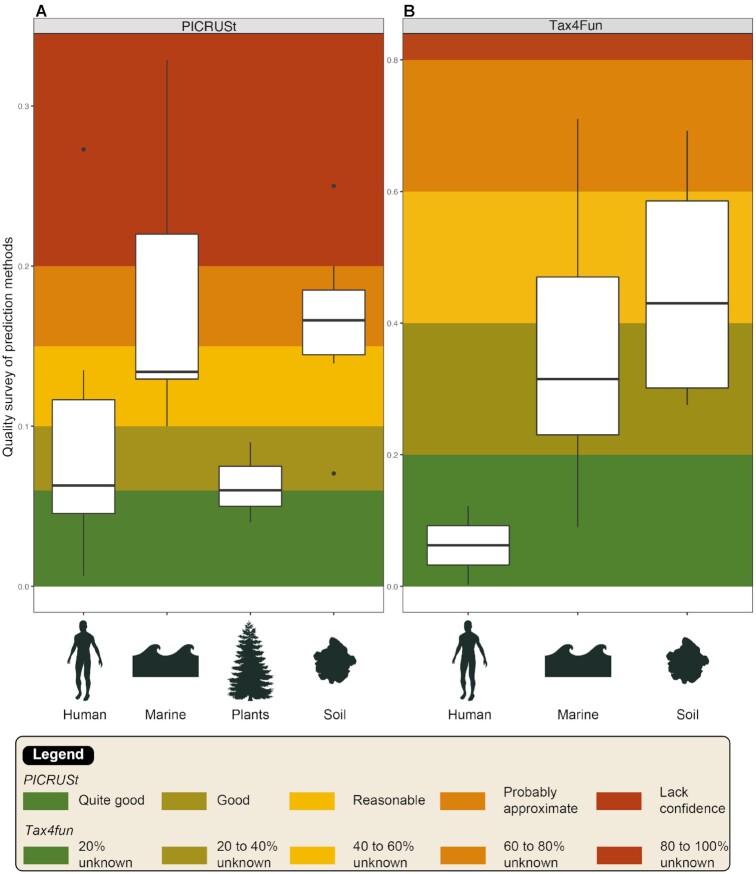
Figure 8:
Overview of the quality of functional prediction based on a subsampling of articles for PICRUSt (A) and Tax4Fun (B) across various ecosystems. For PICRUSt, colors were assigned according NSTI results: <0.06, quite good; 0.06–0.10, good; 0.10–0.15, reasonable but probably approximate; and >0.20, probably unreliable. For Tax4Fun, we split the fraction of OTUs that could not be mapped to KEGG organisms in 5 harmonious groups. References are listed in Additional File 1. The distribution of data are displaying by boxplots and are standardized way of based on a five number summary (minimum, first quartile, median, third quartile, and maximum) and the outliers (shown as black circles).

