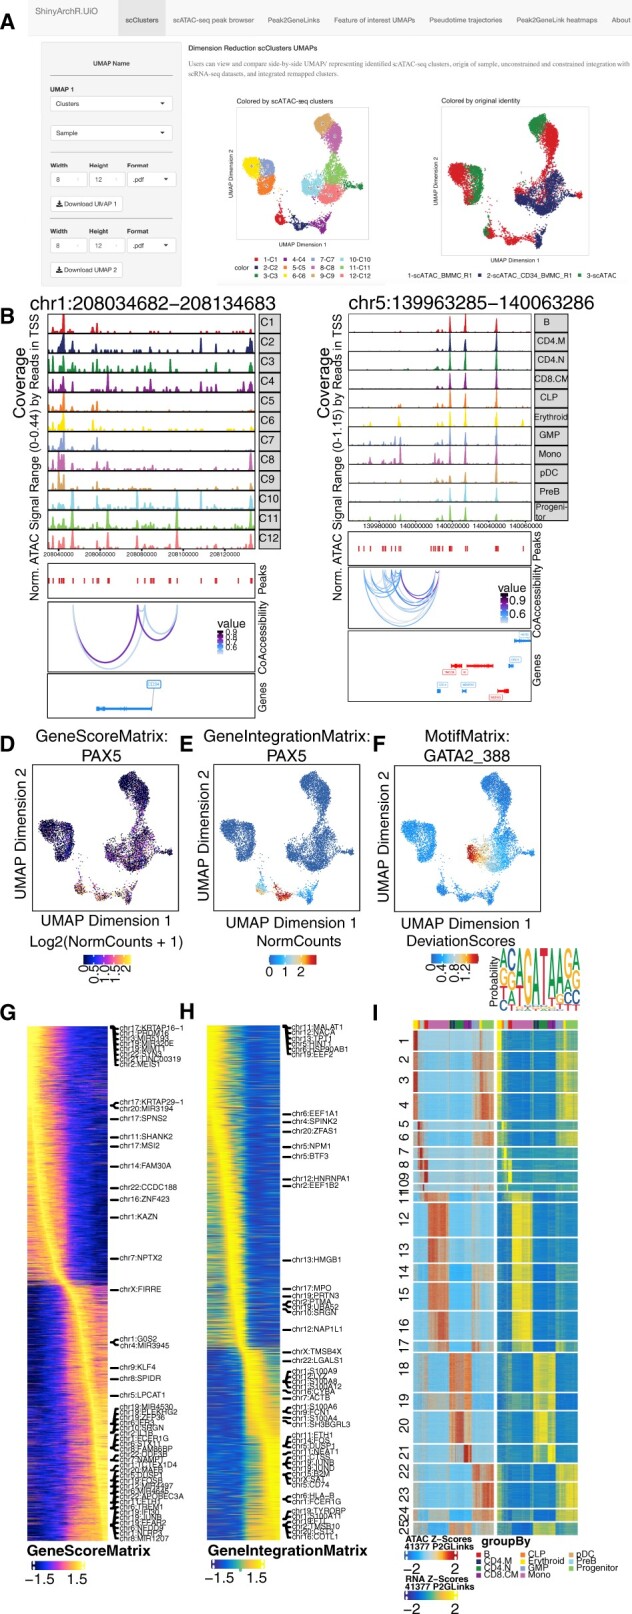
Fig. 1.

ShinyArchR.UiO have different web interfaces where the user can compute and plot scATAC-seq data. Users can select and explore: a) Five different UMAPs side-by-side. b) PlotBrowser of scATAC-seq clusters with peaks and co-accessibility. c) Peak2GeneLinks browser with peaks and co-accessibility. Side-by-side feature comparisons of d) GeneScoreMatrix, e)GeneIntegrationMatrix and f) MotifMatrix with motifseq logo and downloadable list of motif positions. Trajectory heatmaps including g) GeneScoreMatrix, and h) GeneIntegrationMatrix. i) Peak2GeneLink heatmaps of gene scores (left) and gene expression (right). Color bars above each heatmap represent the cell clusters as detailed below
