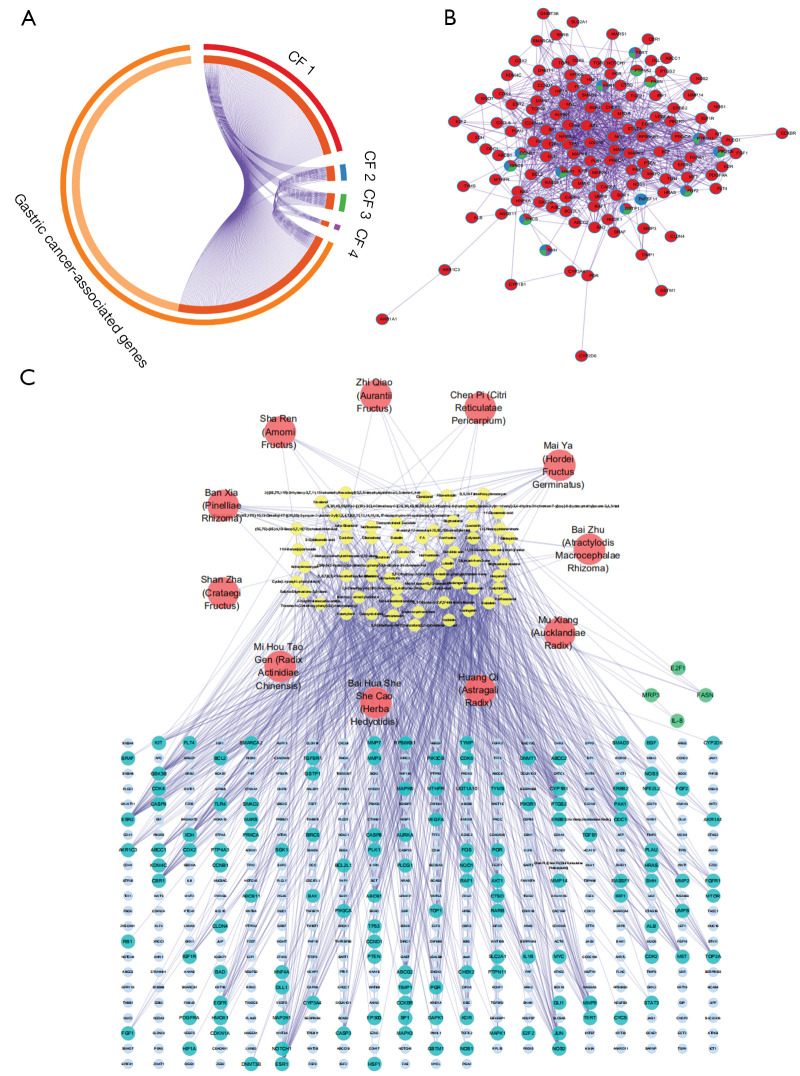
Figure 3.
Target mapping of the candidate formulae to GC-related genes and compound-target network construction of the preferred prescription. (A) Overlapping diagram. The segments of the outside circle represent GC-associated genes (light orange), CF 1 targets (red), CF 2 targets (blue), CF 3 (green) and CF 4 targets (purple). The inside circle, specifically, the dark orange segments represent the overlapping parts. (B) PPI network of GC-related genes of the candidate formulae. The nodes represent GC-related genes/proteins from CF 1 targets (red), CF 2 targets (blue), CF 3 (green), and CF 4 targets (purple). Nodes with more than 1 color represent the shared genes/proteins among different formulae. (C) Compound-target network of the preferred prescription. The nodes represent Chinese herbs (red ellipse), active components (yellow ellipse), GC-associated genes (light blue ellipse), GC-related (turquoise ellipse), and GC-unrelated (green ellipse) predicted targets of the preferred prescription. GC, gastric cancer; CF, candidate formula; PPI, protein-protein interaction.

