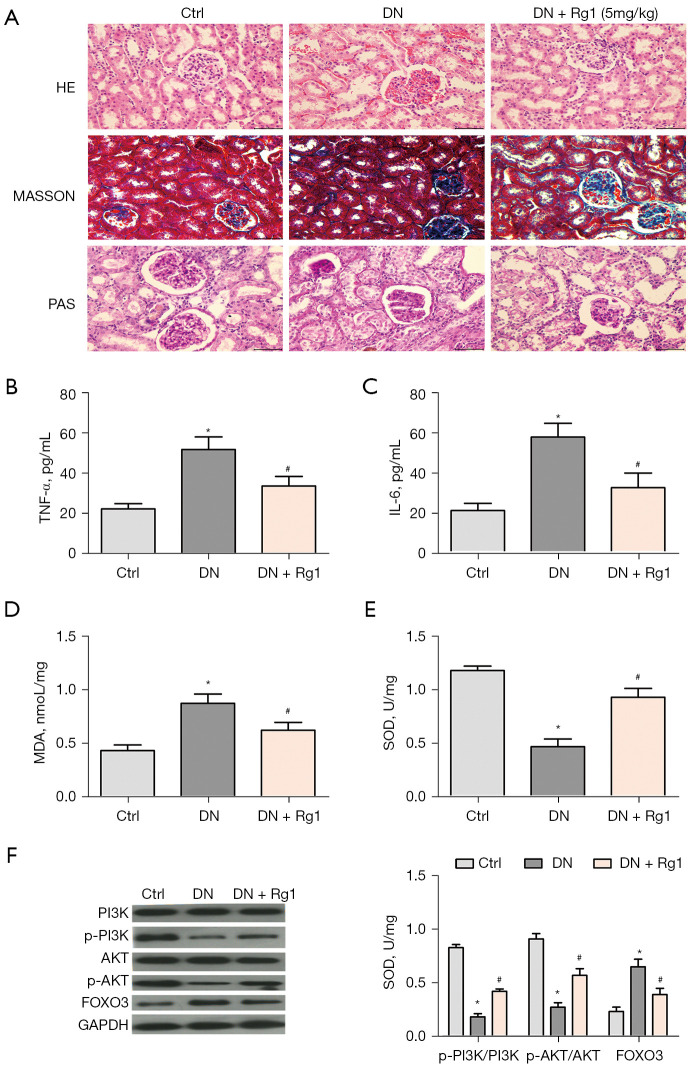
Figure 7.
The effect of Rg1 in DN rat. (A) Diabetic rats were randomly divided into 3 group (n=8): control group, DN group and Rg1 group. Representative photograph for HE, Masson, PAS staining, scale bar =25 µm. (B) Level of TNF-α was determined by ELISA. (C) Level of IL-6 was determined by ELISA. (D) MDA production was determined by ELISA. (E) SOD activity was determined by ELISA. (F) Levels of p-PI3K/PI3K, p-AKT/AKT, and FOXO3 were measured by western blot. *P<0.05 versus control group; #P<0.05 versus the DN group. Rg1, ginsenoside Rg1; DN, diabetic nephropathy; HE, hematoxylin-eosin; p-PI3K, phosphorylation of PI3K; p-AKT, phosphorylation of AKT; MDA, malondialdehyde; SOD, superoxide dismutase; ELISA, enzyme-linked immunoassay.

