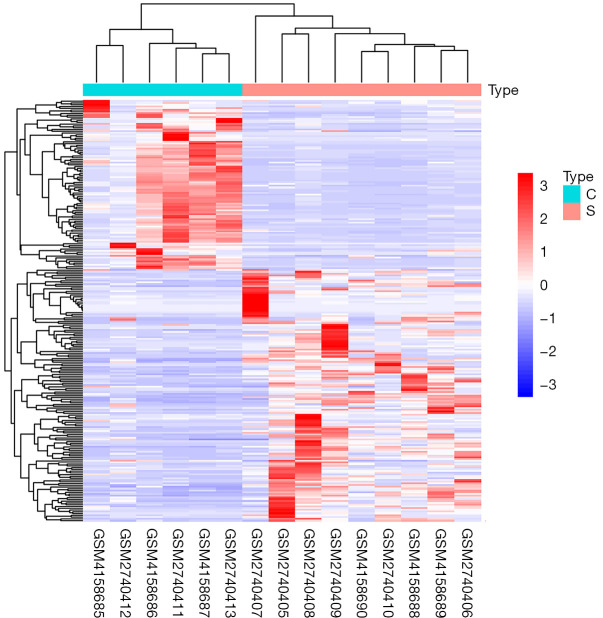
Figure 1.
Differential expression of lncRNAs in blood samples from stroke patients and 6 healthy controls. Type C represents a healthy control blood sample, and type S represents a stroke blood sample. Red represents log2FC <0, indicating that lncRNA expression is upregulated, while blue represents log2FC >0, indicating that lncRNA expression is downregulated.

