Figure 7.

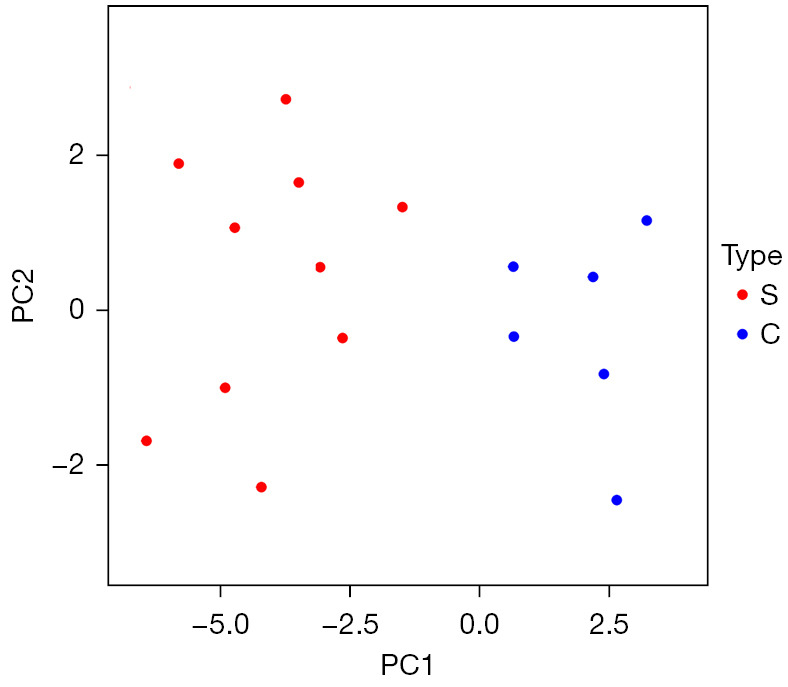
Principal component analysis based on the expression of significantly different lncRNAs. Red indicates stroke blood samples, and blue indicates healthy control blood samples.

Principal component analysis based on the expression of significantly different lncRNAs. Red indicates stroke blood samples, and blue indicates healthy control blood samples.