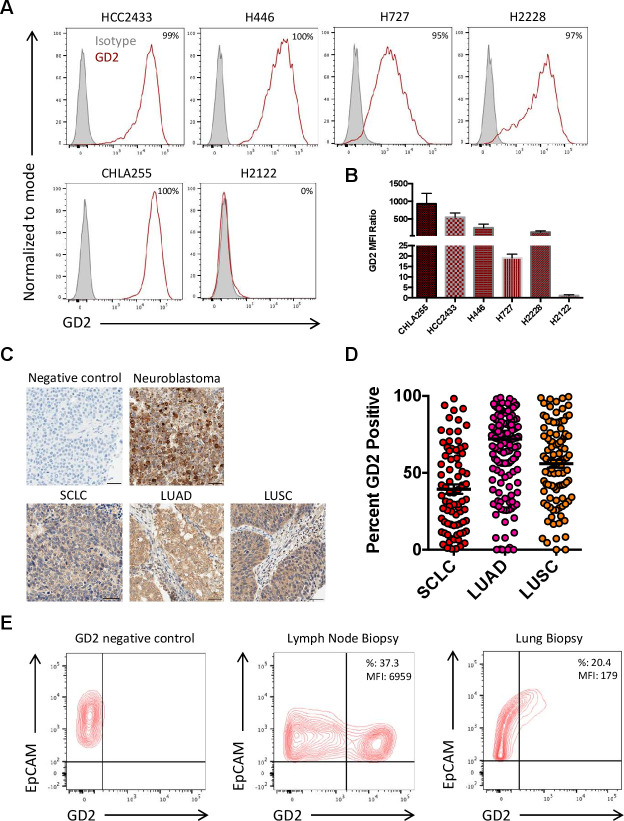
Figure 1.
Expression of GD2 in human lung cancer cell lines, tissue microarray (TMA) and single cell suspensions obtained from lung cancer biopsies. (A, B) Expression of GD2 in SCLC (HCC2433 and H446) and NSCLC (H727 and H2228) cell lines as assessed by flow cytometry. The neuroblastoma cell line CHLA255 and the NSCL cell line H2122 were used as GD2-positive and GD2-negative control, respectively. The results are shown as percentages of positive cells (A) and GD2 mean fluorescent intensity (MFI) ratio (GD2 MFI/Isotype control MFI) (B). Data represent mean±SD (n=3). (C) Representative IHC for GD2 expression in human TMA of SCLC and NSCLC including lung adenocarcinoma (LUAD) and lung squamous cell carcinoma (LUSC). Slides stained only with the secondary Ab were used as a negative control. Neuroblastoma was used as a positive control. Scale bars, 50 µm. (D) GD2 expression scores of the TMAs of SCLC (n=80), LUAD (n=150) and LUSC (n=103). (E) GD2 expression in cell suspensions obtained from lymph node or lung tumor fine-needle aspirates and assessed by flow cytometry. GD2 negative control is illustrated by the left panel. Tumor cells were identified by the expression of the epithelial cell marker EpCAM. EpCAM, epithelial cell adhesion molecule; NSCLC, non-small cell lung cancer; SCLC, small cell lung cancer.

