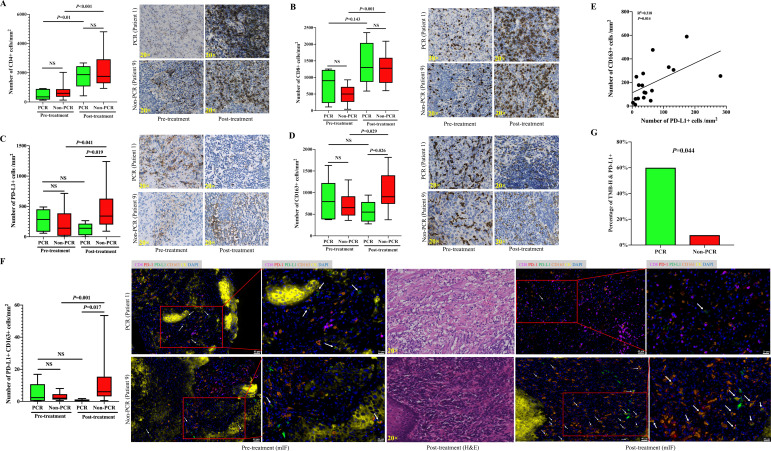
Figure 4.
The immune microenvironment is correlated with the response to neoadjuvant camrelizumab combined with chemotherapy. (A) Comparison of infiltrating CD4+ cells between the PCR group (n=5) and the non-PCR group (n=14) before and after treatment. (B) Comparison of infiltrating CD8+ cells between the PCR group (n=5) and the non-PCR group (n=14) before and after treatment. (C) Comparison of infiltrating PD-L1+ cells between the PCR group (n=5) and the non-PCR group (n=14) before and after treatment. (D) Comparison of infiltrating CD163+ cells between the PCR group (n=5) and the non-PCR group (n=14) before and after treatment. (E) Correlation between infiltrating PD-L1+ and CD163+ cells in post-treatment samples based on multiplex immunofluorescence staining (n=18). (F) Comparison of change in PD-L1+ CD163+ cells between the PCR group (n=5) and the non-PCR group (n=13) before and after treatment based on multiplex immunofluorescence staining. A significant increase in PD-L1+ CD163+ cells (white arrows) is observed after neoadjuvant chemoimmunotherapy in the non-PCR group. Antibody panel: CD8 (magenta), PD-1 (red), PD-L1 (green), CD163 (orange), cytokeratin (CK, yellow), and 2-(4-amidinophenyl)-6-indolecarbamidine dihydrochloride (DAPI, blue). (G) The percentage of patients with both TMB-H and PD-L1+ was significantly higher in the PCR group (n=5) than those in the non-PCR group (n=14). mIF, multiplex immunofluorescence; PCR, pathological complete response; PD-L1, programmed death-ligand 1; TMB-H, tumor mutation burden-high.

