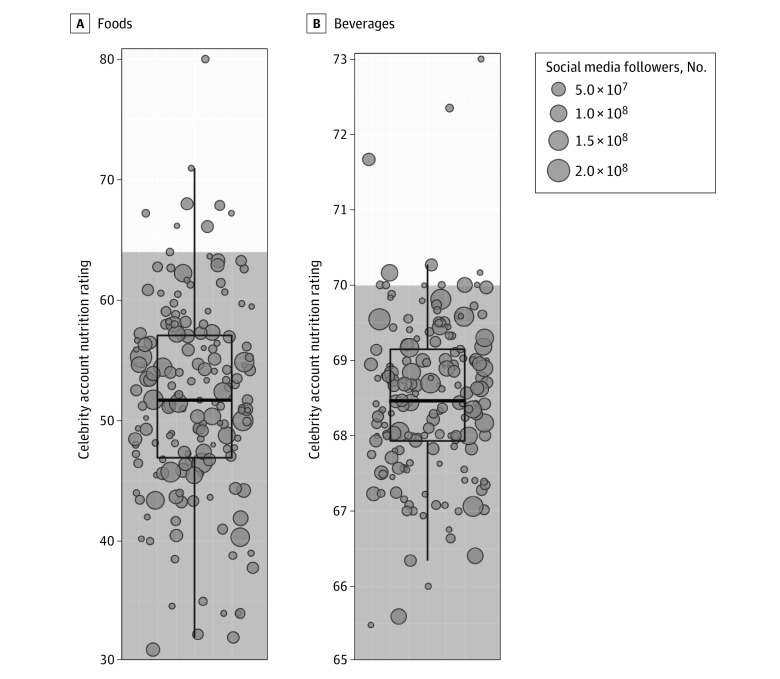
Figure 1. Nutrient Profile Index Nutrition Ratings of Celebrity Social Media Accounts.
Unshaded regions represent nutrition scores classified as “healthier,” and gray shaded regions represent nutrition scores classified as less healthy by the Nutrition Profile Index. Boxes represent the IQRs (25th and 75th percentiles), the inner horizontal line of each box represents the median, and vertical whiskers represent 1.5 times the IQR. Each dot represents the mean Nutrition Profile Index nutrition score for 1 celebrity, and dot size corresponds to the number of social media followers, with larger size indicating more followers.

