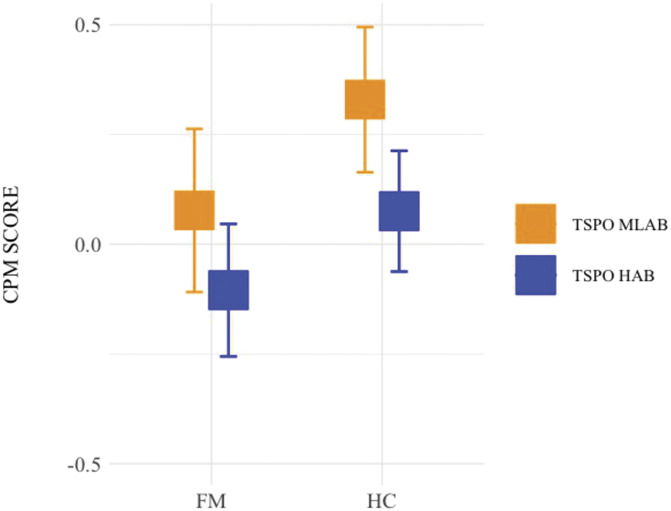
Figure 2.

CPM score per group (FM, HC) by TSPO polymorphism (HAB, MLAB). Error bars represent the lower and the upper 95% confidence intervals. Squares represent the mean of the data. CPM, conditioned pain modulation; FM, fibromyalgia; HAB, high affinity binders; HC, healthy controls; MLAB, mixed/low affinity binders; TSPO, translocator protein; FM MLAB = 30; FM HAB = 51; HC MLAB = 21; HC HAB = 21.
