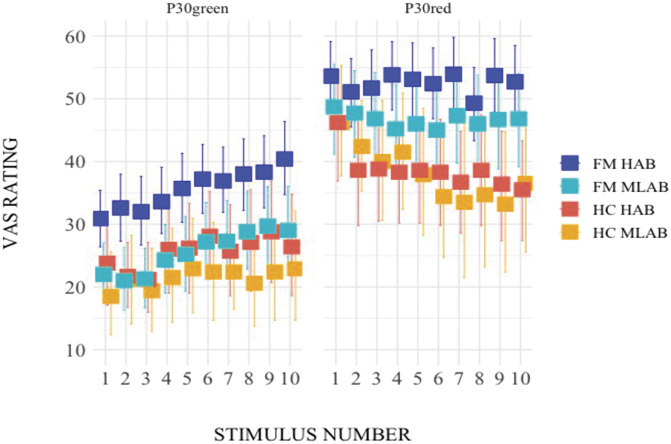
Figure 4.

VAS pain ratings during the instructed pressure pain conditioning paradigm displayed by group (FM, HC) and TSPO polymorphism (HAB, MLAB). Error bars represent the lower and the upper 95% confidence intervals. Squares represent the mean of the data. VAS, visual analogue scale; P30green, midintensity pain pressure presented after a green cue and obtained by averaging individually calibrated low and high pain pressures, P10 (10/100-mm VAS) and P50 (50/100-mm VAS), respectively; P30red, midintensity pain pressure presented after a red cue and obtained in the same manner as P30green (see description above); FM, fibromyalgia; HAB, high affinity binders; HC, healthy controls; MLAB, mixed/low affinity binders; TSPO, translocator protein; VAS, visual analogue scale; FM MLAB = 30, FM HAB = 48, HC MLAB = 17, and HC HAB = 21.
