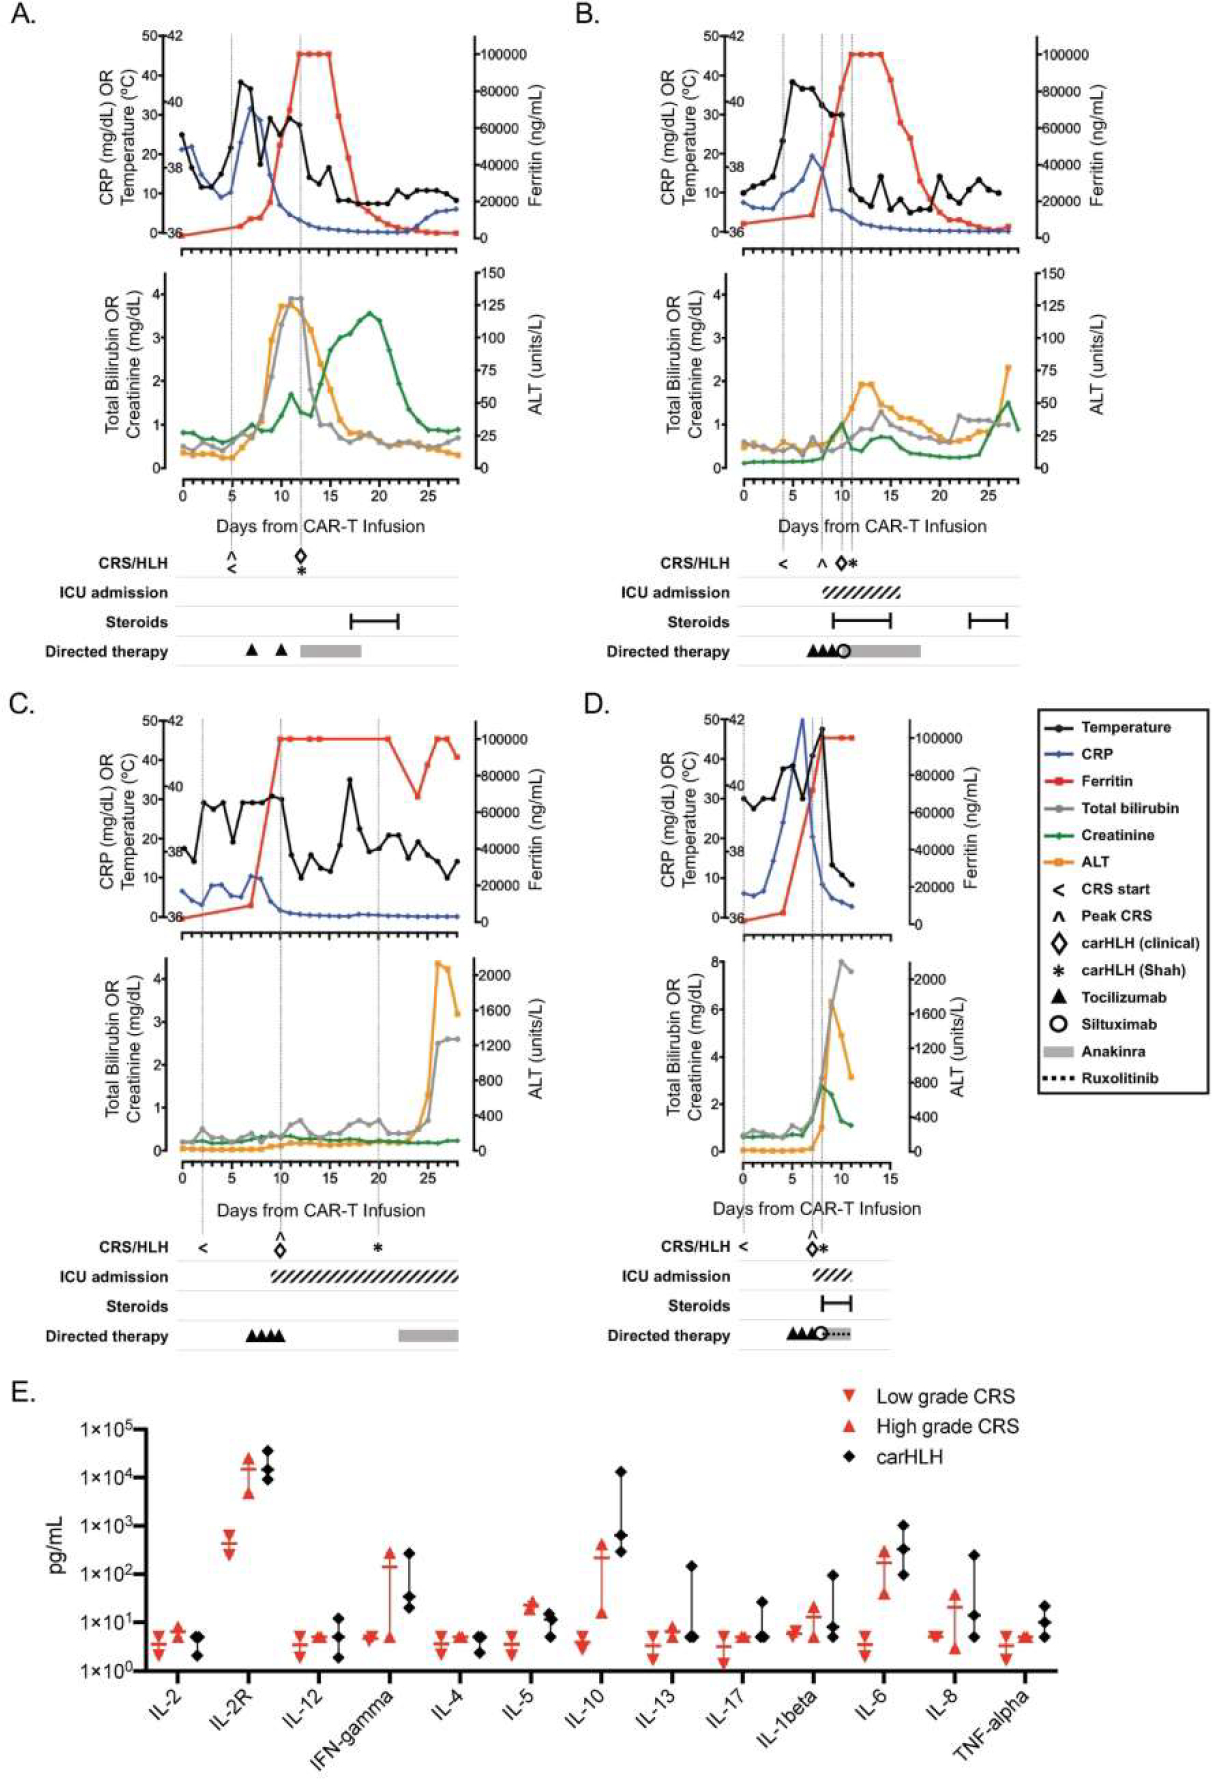
Figure 1. Clinical course of patients with carHLH after CAR T-cell therapy.

Graphical representation of clinical course of patients (n=4) who developed carHLH after receipt of CD19-CAR T-cell therapy, with each panel (A-D) representing a unique patient/infusion. Temperature and laboratory markers of inflammation and organ function are displayed temporally from CAR T-cell infusion until 30-days post-infusion (or until death, whichever was sooner), with corresponding timing of ICU admission (if applicable) and therapeutics administered for CRS and/or carHLH. Temperature (black), CRP (C-reactive protein; blue) and ferritin (red) are shown on top graphs for each patient. Total bilirubin (grey), creatinine (green) and ALT (alanine aminotransferase; yellow) are shown on the lower graphs for each patient (A-D). Vertical lines are shown to indicate start of CRS, day of peak CRS grade, and day of carHLH diagnosis (clinically and by Shah (6) criteria). Panel E depicts comparison of available serum cytokine levels between low grade CRS (red, downward triangle; n=2; Grade 1), high grade CRS (red, upward triangle n=2; Grade 3) and carHLH (n=3) patients. Bar represents median values with range. Cytokine analysis (ARUP Laboratories, Salt Lake City, UT) were obtained +/−3 days from carHLH/CRS diagnosis.
