. 2021 Aug 18;27(21):5961–5978. doi: 10.1158/1078-0432.CCR-21-0986

Figure 2.

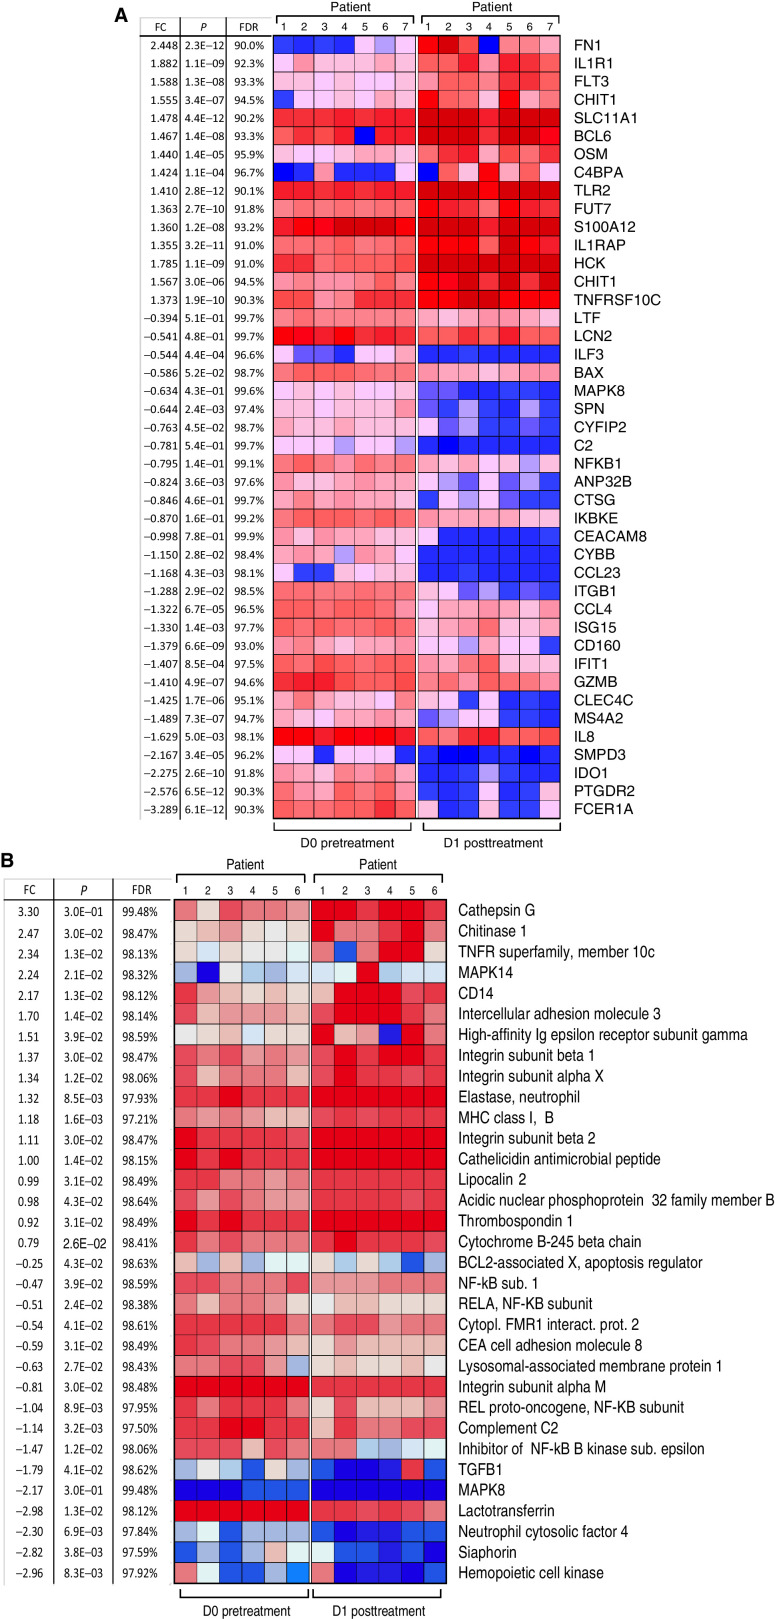
Figure 2. Effect of MTL-CEBPA treatment of patients with HCC on gene and protein expression in myeloid cells. A, Gene-expression profile was evaluated by NanoString using the human PanCaner IO 360 panel. Heat map of gene-expression upregulated (+1> log2 fold change and above) or downregulated (−1< log2 fold change and below) with a false discovery rate (FDR) of <5% is shown. B, Protein expression profile was evaluated by mass spectroscopy. Proteins with P < 0.05 and absolute log2 fold change > 1 were considered as significantly differentially expressed. Adjusted P values were calculated by correcting for an FDR of <5%.

Effect of MTL-CEBPA treatment of patients with HCC on gene and protein expression in myeloid cells. A, Gene-expression profile was evaluated by NanoString using the human PanCaner IO 360 panel. Heat map of gene-expression upregulated (+1> log2 fold change and above) or downregulated (−1< log2 fold change and below) with a false discovery rate (FDR) of <5% is shown. B, Protein expression profile was evaluated by mass spectroscopy. Proteins with P < 0.05 and absolute log2 fold change > 1 were considered as significantly differentially expressed. Adjusted P values were calculated by correcting for an FDR of <5%.