. 2021 Aug 18;27(21):5961–5978. doi: 10.1158/1078-0432.CCR-21-0986

Figure 3.

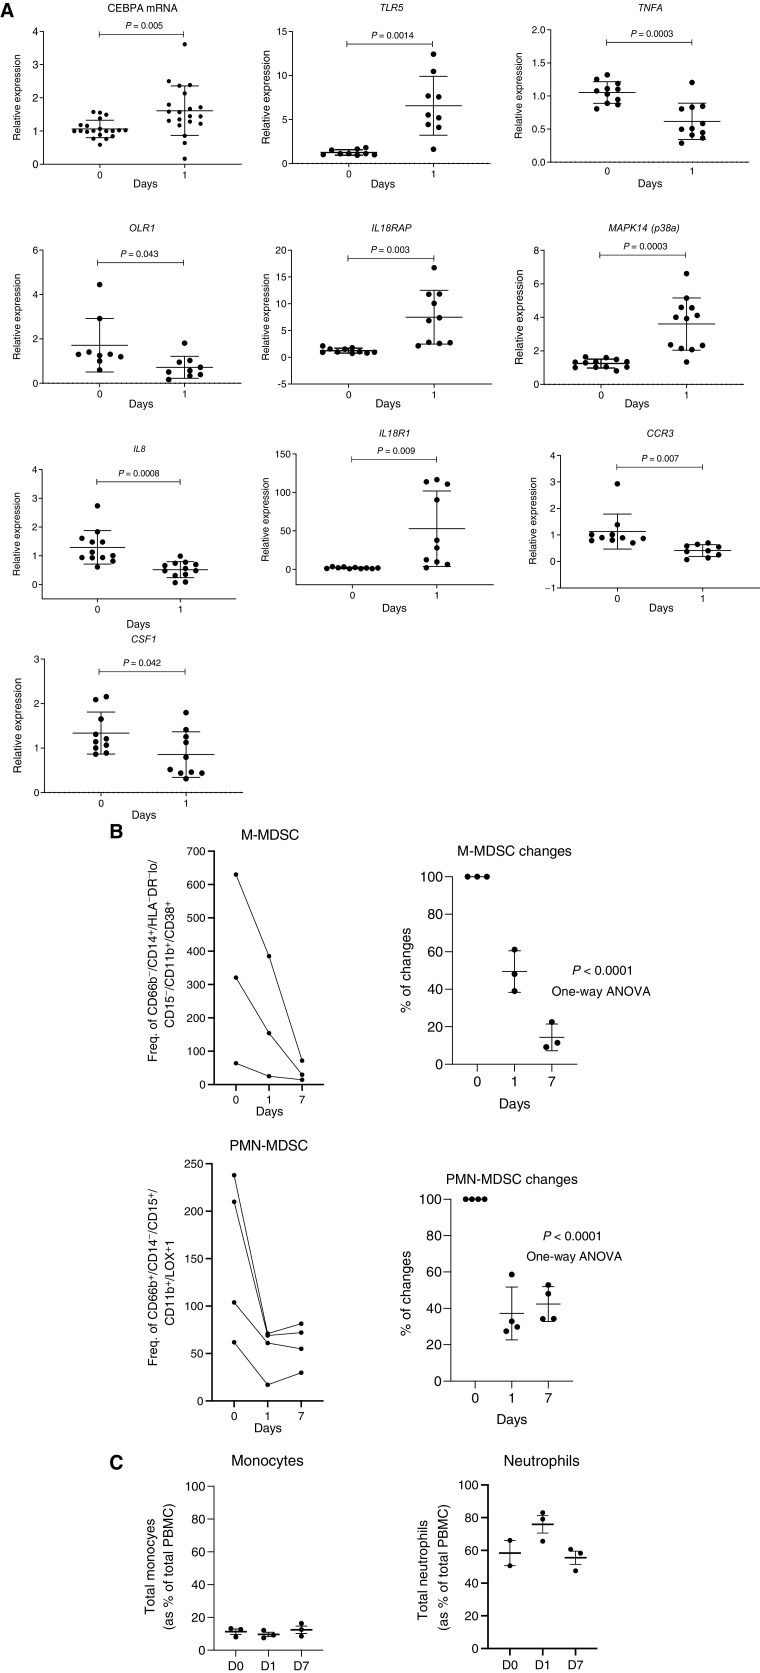
Figure 3. Changes in gene expression in total leukocytes in patients treated with MTL-CEBPA. A, Expression of indicated genes in leukocytes from 12 patients. Gene expression was evaluated by qRT-PCR. Individual results, mean, and standard deviation are shown. P values are calculated using two-sided Student t test. B, the presence of M-MDSCs (CD66b− CD14+ HLA-DR−/loCD15− CD11b+CD38+) and PMN-MDSCs (CD66b+CD14−CD15+CD11b+ LOX1+) among mononuclear cells was analyzed by flow cytometry and represented as frequency of gated cell population at 60K event per 1 × 10⁶ cells (n = 3). C, Total circulating population of monocytes and neutrophils in the same patients was measured as a percentage of total PBMC.

Changes in gene expression in total leukocytes in patients treated with MTL-CEBPA. A, Expression of indicated genes in leukocytes from 12 patients. Gene expression was evaluated by qRT-PCR. Individual results, mean, and standard deviation are shown. P values are calculated using two-sided Student t test. B, the presence of M-MDSCs (CD66b CD14+ HLA-DR−/loCD15 CD11b+CD38+) and PMN-MDSCs (CD66b+CD14CD15+CD11b+ LOX1+) among mononuclear cells was analyzed by flow cytometry and represented as frequency of gated cell population at 60K event per 1 × 10⁶ cells (n = 3). C, Total circulating population of monocytes and neutrophils in the same patients was measured as a percentage of total PBMC.