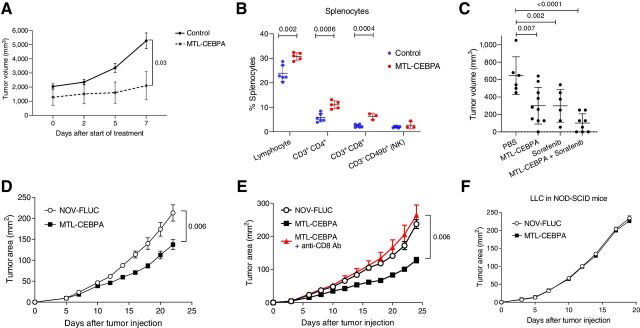
Figure 5.
The effect of MTL-CEBPA on tumor growth in mouse tumor models. MTL-CEBPA and control NOV-FLUC were intravenously injected to the tumor-bearing mice at 3 mg/kg twice a week from day 5. A, Kinetic of tumor growth in mice bearing BNL HCC cell line (n = 5). P value was calculated using two-way ANOVA test. B, The presence of the indicated cell population in spleens of NBL tumor–bearing mice presented as percentages (%). C, Tumor volume in NBL tumor–bearing mice treated with MTL-CEBPA and sorafenib after 10 days of treatment. Mean and standard deviation are shown. n = 6 for PBS control- and sorafenib-treated groups, n = 10 for the MTL-CEBPA–treated group, n = 8 for the combination group. P values were calculated in one-way ANOVA test with corrections for multiple comparisons. D, Kinetics of LLC tumor growth (n = 5 per group). P value was calculated using two-way ANOVA test. E, Kinetics of LLC tumor growth in the mice depleted of CD8 T cells and treated with MTL-CEBPA (n = 5 per group). Mean and standard deviation are shown. P values were calculated using two-way ANOVA. F, Kinetics of tumor growth in NOD-SCID mice (n = 4 and 5 per group).

