
FIGURE 2.
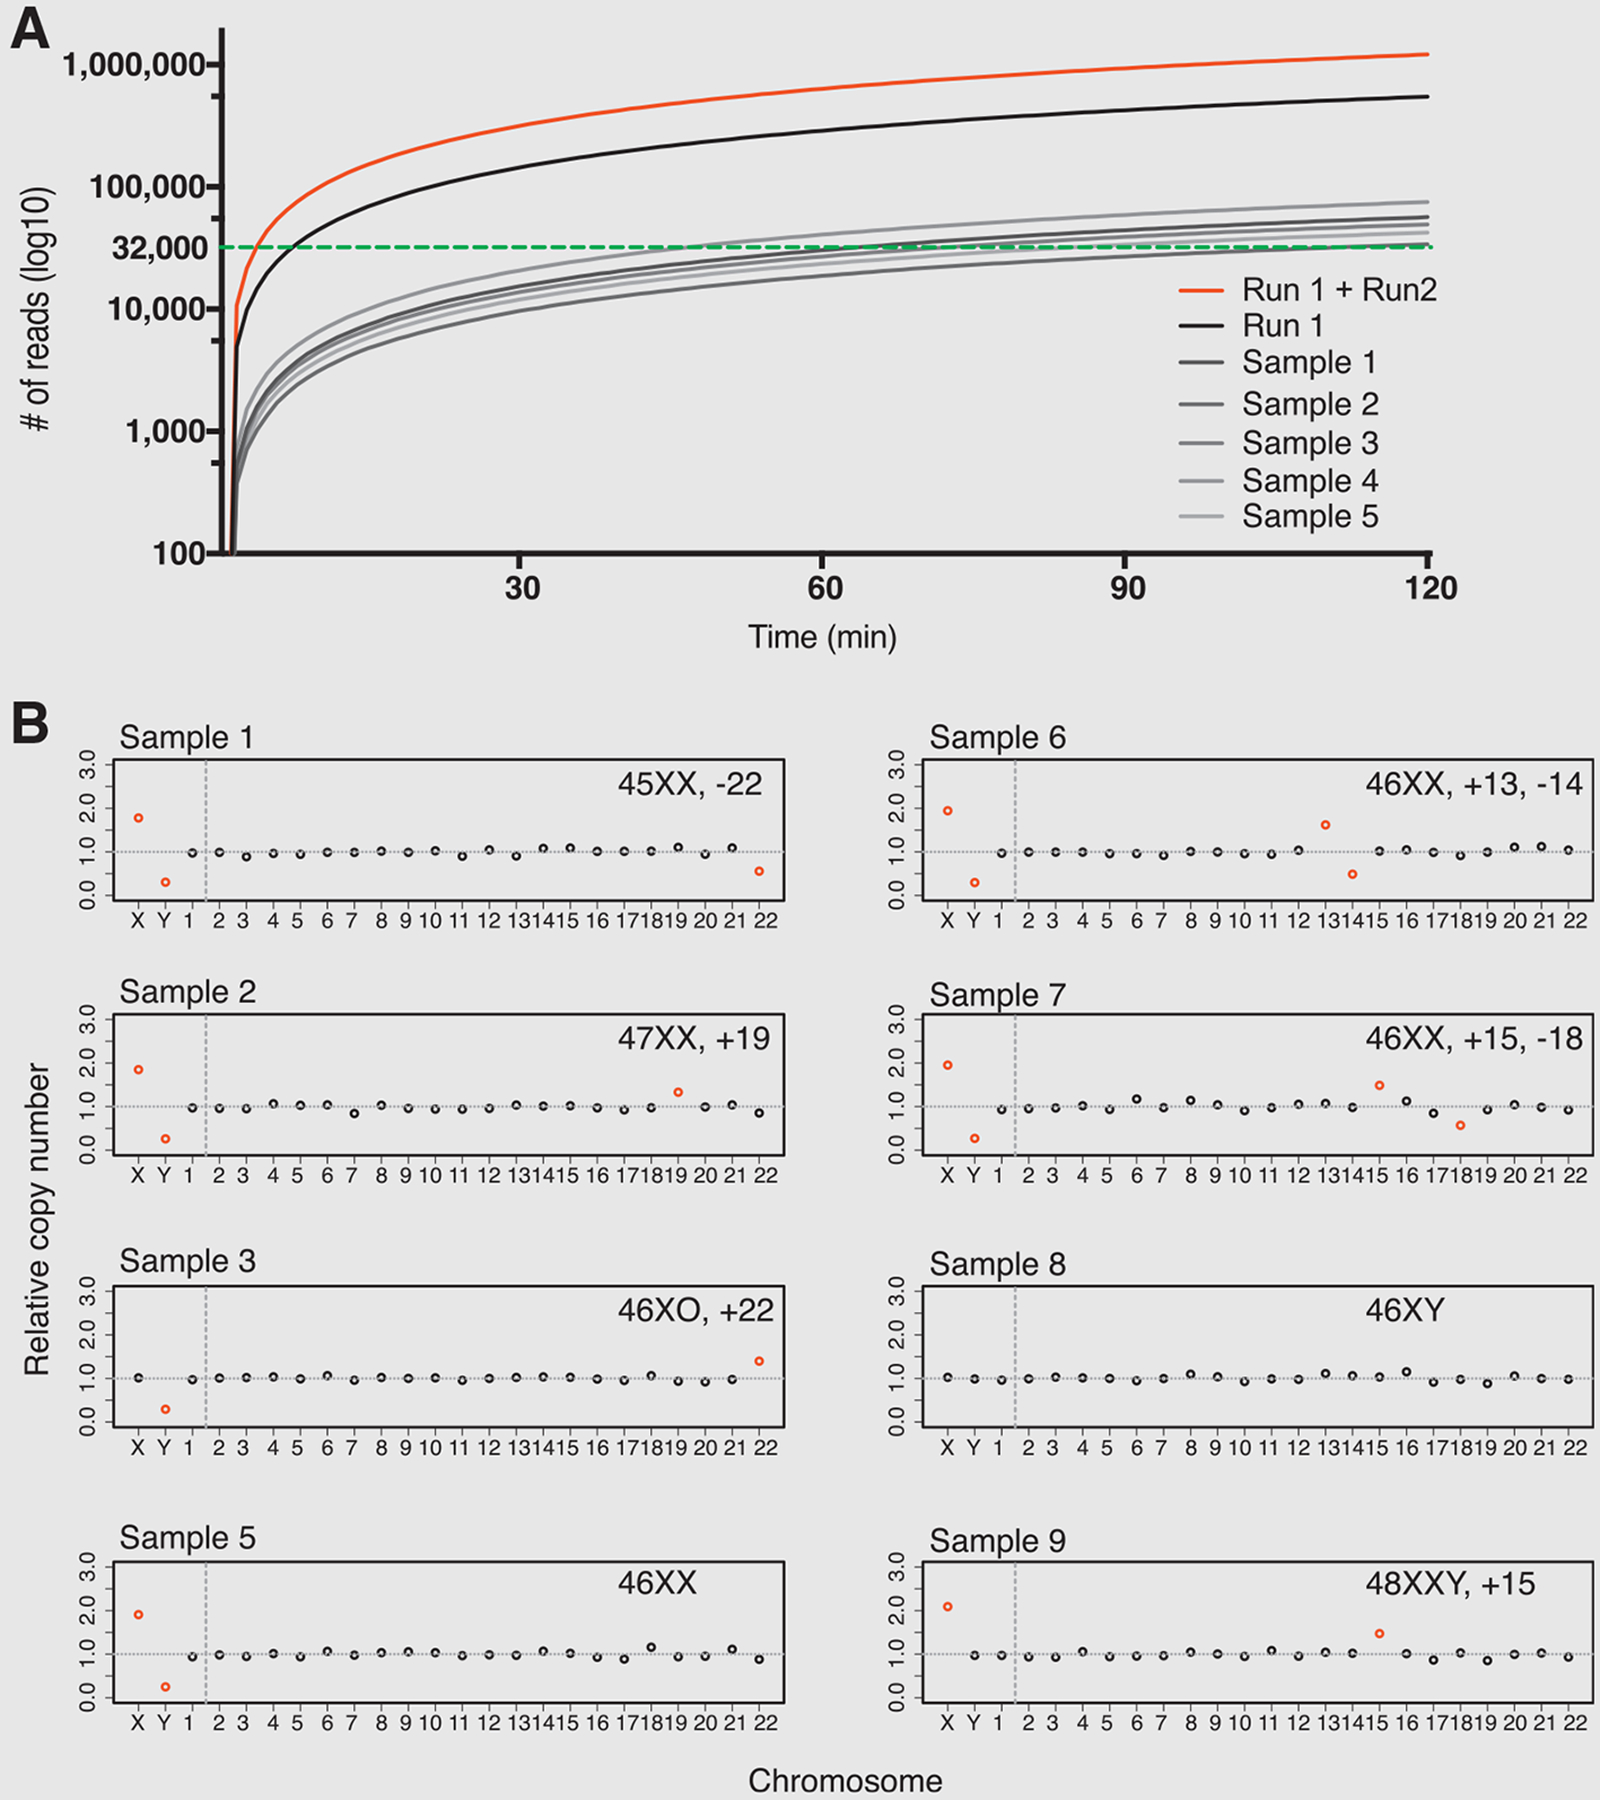
MinION assay results. (A) MinION nanopore sequencing representative yield performance (grayscale, sample 1–5; black, run 1 accumulative; red, run 1 and run 2 accumulative; green dotted line, threshold for ≥ 30K uniquely aligned reads for downstream analysis). (B) MinION-assisted aneuploidy detection results. The abnormality of each chromosome was indicated by color (red, significantly abnormal; black, normal).