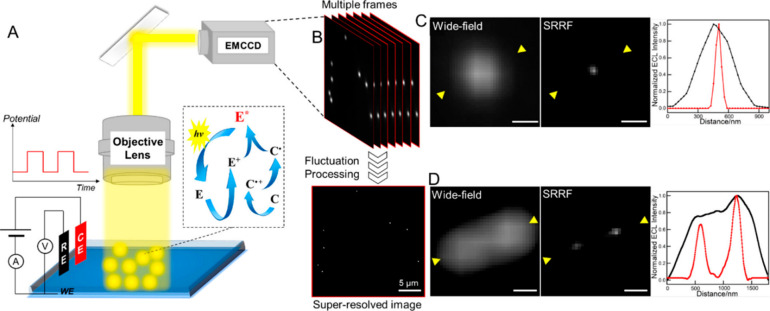
Figure 2.
(A) Schematic illustration of the ECLM system for single-particle imaging. E and C represent the luminophore and coreactant, respectively, which are Ru(bpy)32+ and TPrA. (B) Basic principle of SRRF analysis of multiple images. Wide-field and super-resolution ECL images of (C) a single Au nanosphere and (D) separated Au nanospheres and corresponding line profiles taken from the regions between the yellow arrowheads. Scale bar: 500 nm. Reproduced from Chen, M.-M.; Xu, C.-H.; Zhao, W.; Chen, H.; Xu, J. J. Am. Chem. Soc.2021, 143, 18511–18518 (ref (20). Copyright 2021 American Chemical Society.

