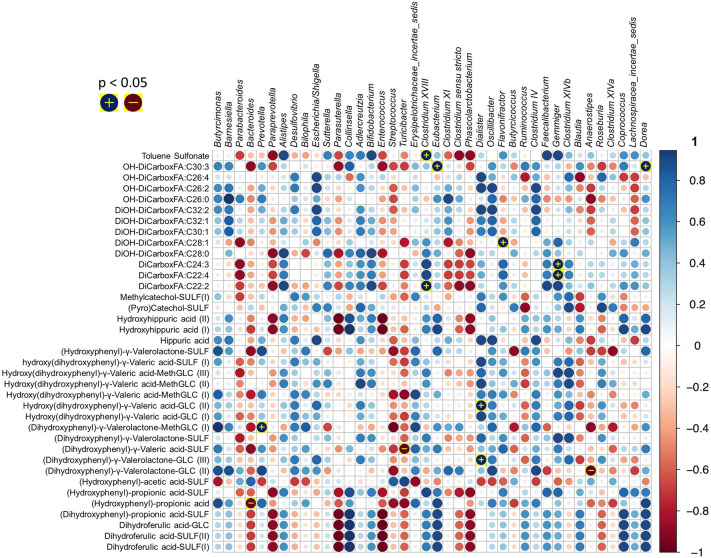
Figure 5.
Heatmaps correlating area under curve (apple polyphenol extract) of metabolites measured over 5 h in blood and genus level 16S rRNA relative abundance of faecal microbiota present in each subject. [Reprinted with permission from ref (127). Copyright 2018, Elsevier.]

