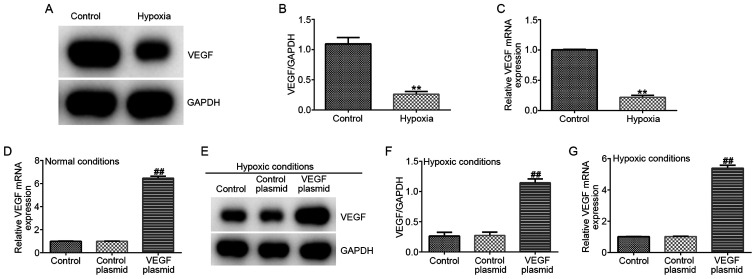
Figure 5.
VEGF expression in EPCs under hypoxic conditions. A hypoxia EPC model was established through exposing cells to hypoxia. (A) Western blot assay was used measure the protein expression of VEGF in EPCs, (B) which was quantified. (C) RT-qPCR analysis was used to measure the protein and mRNA expression of VEGF in EPCs. (D) EPCs were transfected with control-plasmid or VEGF-plasmid under normal conditions for 72 h, then the mRNA expression of VEGF in EPCs was measured by RT-qPCR. (E-G) EPCs were transfected with control-plasmid, VEGF-plasmid under hypoxic conditions for 72 h. (E) Protein expression of VEGF in EPCs was measured by western blotting, (F) which was quantified (G) mRNA expression of VEGF in EPCs was measured by RT-qPCR analysis. **P<0.01 vs. Control. ##P<0.01 vs. control-plasmid. EPCs, endothelial progenitor cells; RT-qPCR, reverse transcription-quantitative PCR.

