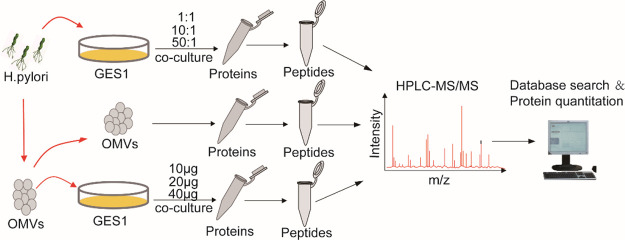
Figure 2.
Schematic experimental workflow: First, the contents of purified OMVs were examined using HPLC-MS/MS. Then, GES1 cells cocultured with gradually increasing concentrations of OMVs and H. pylori were subjected to quantitative proteomic analysis. Finally, bioinformatics analysis was performed on the above data, on which basis, the exact pathways and proteins that changed in the infected GES1 cell proteome were characterized. The MS analysis of each sample was performed in triplicate, and data analysis was performed with the software PD2.2.

