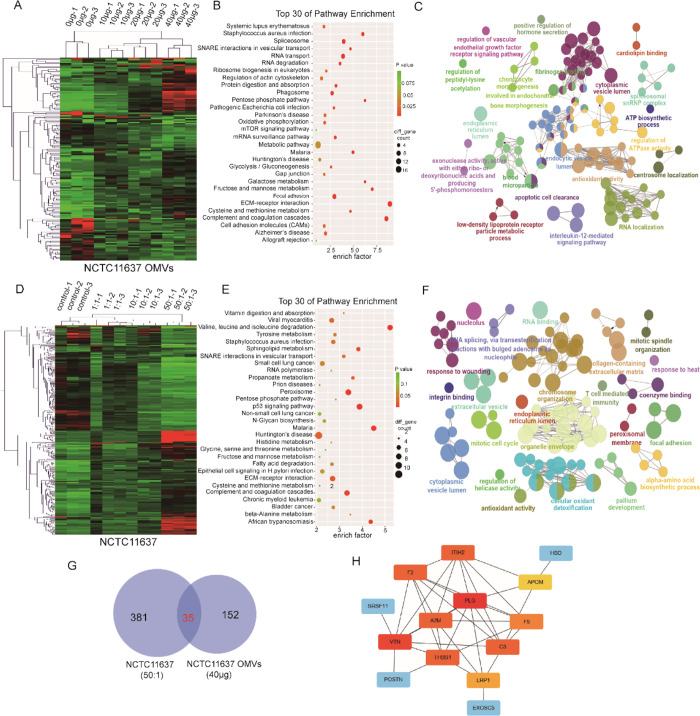
Figure 5.
Proteomic changes of GES1 infected by NCTC11637 OMVs and bacteria. (A) Heat map showing differentially expressed proteins in different groups of GES1 cocultured with increasing NCTC11637 OMVs (0, 10, 20, and 40 μg/well). (B) KEGG analysis of differentially expressed proteins in GES1 control and GES1 cocultured with 40 μg of NCTC11637 OMVs. (C) GO analysis of differentially expressed proteins in GES1 control and GES1 cocultured with 40 μg of NCTC11637 OMVs. (D) Heat map showing differentially expressed proteins in different groups of GES1 cocultured with increasing NCTC11637 (0, 1:1, 10:1, and 50:1). (E) KEGG analysis of differentially expressed proteins in GES1 control and GES1 cocultured with 50:1 NCTC11637. (F) GO analysis of differentially expressed proteins in GES1 control and GES1 cocultured with 50:1 NCTC11637. (G) Venn diagram revealed the overlapped proteins between differentially expressed proteins in GES1 infected by NCTC11637 and OMVs. (H) Top 10 hub genes of the overlapped proteins in panel G.

