Figure 6.
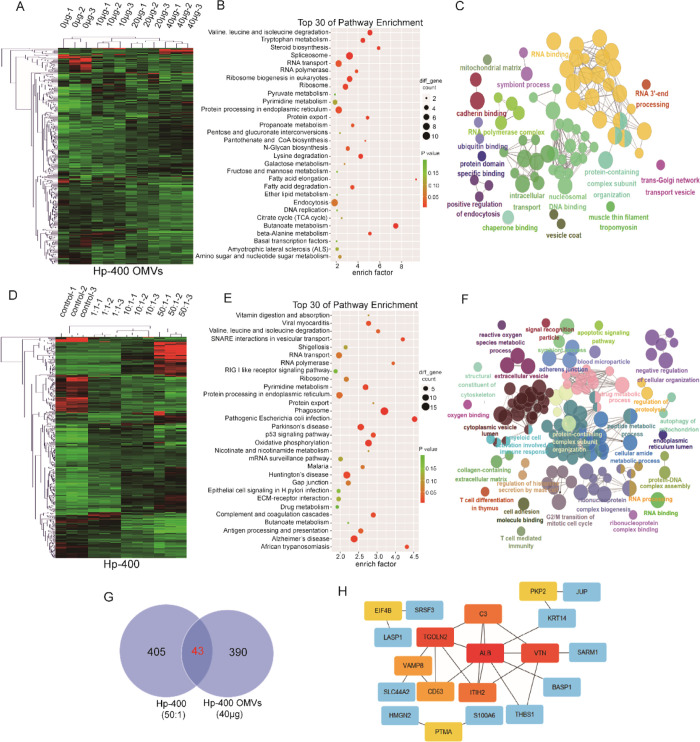
Proteomic changes of GES1 infected by Hp-400 OMVs and bacteria. (A) Heat map showing differentially expressed proteins in different groups of GES1 cocultured with increasing Hp-400 OMVs (0, 10, 20, and 40 μg/well). (B) KEGG analysis of differentially expressed proteins in GES1 control and GES1 cocultured with 40 μg of Hp-400 OMVs. (C) GO analysis of differentially expressed proteins in GES1 control and GES1 cocultured with 40 μg of Hp-400 OMVs. (D) Heat map showing differentially expressed proteins in different groups of GES1 cocultured with increasing Hp-400 (0, 1:1, 10:1, and 50:1). (E) KEGG analysis of differentially expressed proteins in GES1 control and GES1 cocultured with 50:1 Hp-400. (F) GO analysis of differentially expressed proteins in GES1 control and GES1 cocultured with 50:1 Hp-400. (G) Venn diagram revealed the overlapped proteins between differentially expressed proteins in GES1 infected by Hp-400 and OMVs. (H) Top 10 hub genes of the overlapped proteins in panel G.

