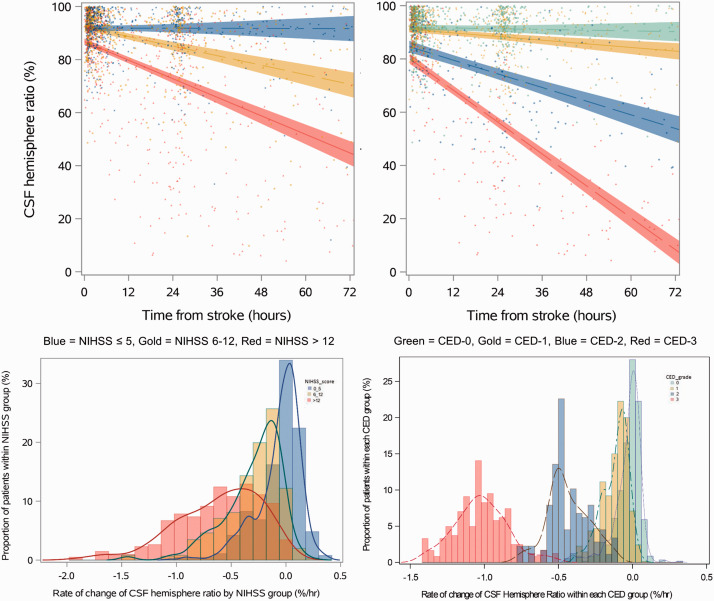
Figure 3.
Hemispheric CSF ratio over time, modeled by NIHSS (left) and CED (right) strata. Hemispheric CSF ratio modeled over time in 924 stroke patients, divided by baseline stroke severity (left) and in 738 with follow-up CTs divided by CED grades (right). NIHSS strata are mild (0-5) in blue, moderate (6-12) in gold, and severe (> 12) in red. Edema severity groups are CED-0 (green), CED-1 (gold), CED-2 (blue), and CED-3 (red). The top panel shows group slopes using linear mixed models. The bottom panel shows histograms comparing the estimated slopes of individual subjects within each strata.

