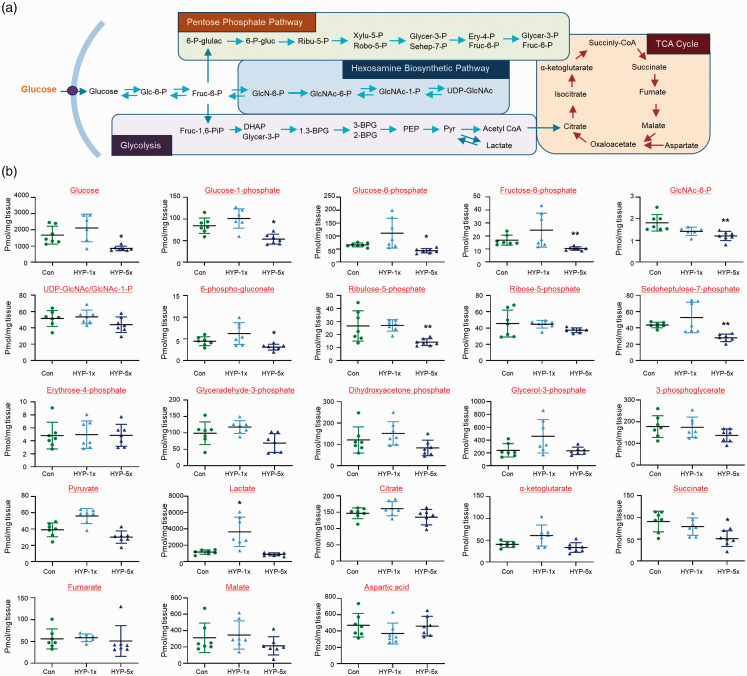
Figure 2.
Changes of metabolites in zebrafish brains. (a) Schematic presentation of selected metabolites from glycolysis, the pentose phosphate pathway (PPP), the TCA cycle, and HBP. (b) Graphs represent quantification of selected metabolites by GC-MS/MS in brains of control normoxia (Con), single hypoxia (SH; 1×) and five repeated exposures to hypoxia (RH; 5×) groups (n=31/group). Data are represented as mean ± standard deviation. Statistical analysis was carried out by Kruskal-Wallis with false discovery rate (FDR) multiple comparison test (*p<0.05, **p<0.01 vs. Con).

