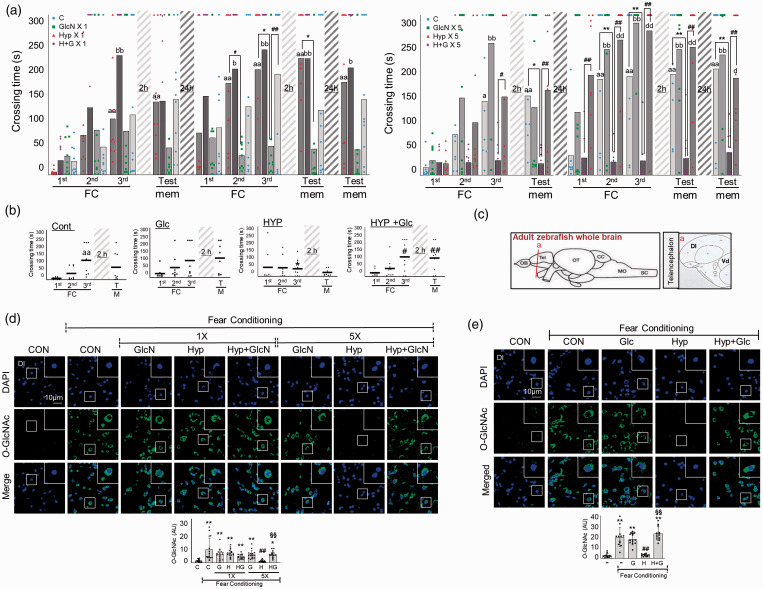
Figure 3.
Effects of GlcN or glucose on hypoxia-induced L/M dysfunction. (a) Zebrafish were subjected to intraperitoneal injection of 200 μg/g GlcN (G) 2 h prior to each bout of hypoxia during RH. Representative results obtained from the fear context passive avoidance test for the effect of GlcN on SH (1×) (left) or RH (5×) (right). Dots indicate the individual crossing time and bars represent the mean crossing time (n=8–12/group). For Fear-conditioning test analysis within a group, repeated measures nonparametric ANOVA (Friedman’s test) with FDR was used for multiple comparisons (aap<0.05 or aap<0.01 vs. the 1st FC of Con, bp<0.05 or bbp<0.01 vs. the 1st FC of GlcN X1 or GlcN X5, dp<0.05 or ddp<0.01 vs. the 1st FC of H+G X1 or H+G X5). Analysis between groups, two-way ANOVA followed by Turkey multiple comparisons test was performed (*p<0.05, **p<0.01 vs. Con, #p<0.05, ##p<0.01 vs. Hyp X1 or Hyp X5). (b) Glucose (Glc, 1 mg/g) was intraperitoneally injected to zebrafish 2 h prior to each bout of hypoxia during RH (HYP, H). Passive avoidance tests were performed. Dots represent the individual crossing time and bars indicate the mean crossing time (n=8–9/group). Data analysis within a group, repeated measures nonparametric ANOVA (Friedman’s test) with FDR was used for multiple comparisons (aap<0.01 vs. the 1st FC of Con). Analysis between groups, two-way ANOVA followed by Turkey multiple comparisons test was performed (*p<0.05 vs. Con, #p<0.05, ##p<0.01 vs. Hyp). (c) Schematic depiction of zebrafish brain subregions; lateral zone of dorsal telencephalon (Dl) and ventral telencephalon (Vd) are shown in (a) box. (d and e) Zebrafish were intraperitoneally injected with GlcN (d) or glucose (e) 2 h prior to SH (1×) or each bout of hypoxia during RH (5×). Representative confocal images (x40) of DAPI (blue) and O-GlcNAc (green) and merged immunofluorescence staining of the Dl region of zebrafish telencephalon at 6 h after FC. Enlarged images are presented in the white boxes. Graphs represent densitometric quantification of O-GlcNAc (n=5/group in D, n=4/group in E). Statistical analysis was carried out by Kruskal-Wallis with false discovery rate (FDR) multiple comparison test. (*p<0.05, **p<0.01 vs. Cont, #p<0.05, ##p<0.01 vs. fear-conditioned Cont, §§p<0.01 vs. fear-conditioned RH.)

