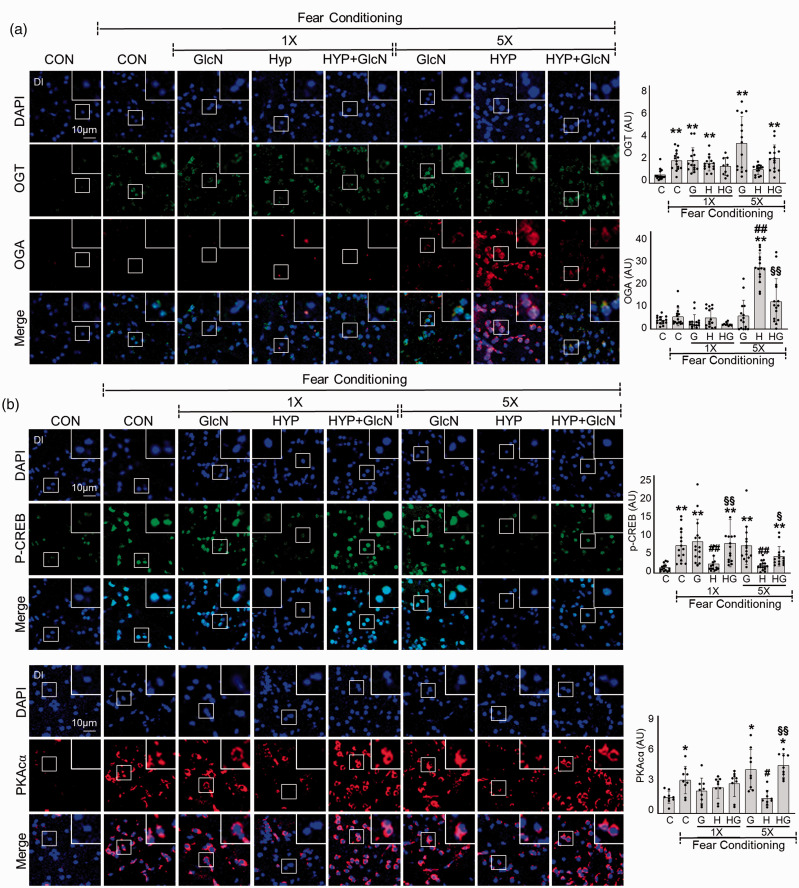
Figure 4.
Effects of GlcN on OGA and OGT expression and PKA/CREB signaling in control, SH and RH zebrafish. Zebrafish were exposed to SH (1×) or RH (5×) with or without intraperitoneal pre-injection of GlcN (G, 200 μg/g) at 2 h prior to each bout of hypoxia. Representative confocal images (x40) of DAPI (blue), OGT (green) and OGA (red, A), and p-CREB (green,B) and PKAcα (red, B) and merged immunofluorescence staining of the Dl of zebrafish brain at 6 h after FC in the control (normoxia, CON or C), SH (1×), and RH (5×) hypoxic (HYP or H) groups. Enlarged images are presented in the white boxes. Graphs represent densitometric quantification of OGT, OGA, p-CREB or PKAcα (n=3–5/group). Statistical analysis was carried out by Kruskal-Wallis with false discovery rate (FDR) multiple comparison test. (*p<0.05, **p<0.01 vs. Cont, #p<0.05, ##p<0.01 vs. fear-conditioned Cont, §p<0.05, §§p<0.01 vs. fear-conditioned RH.)

