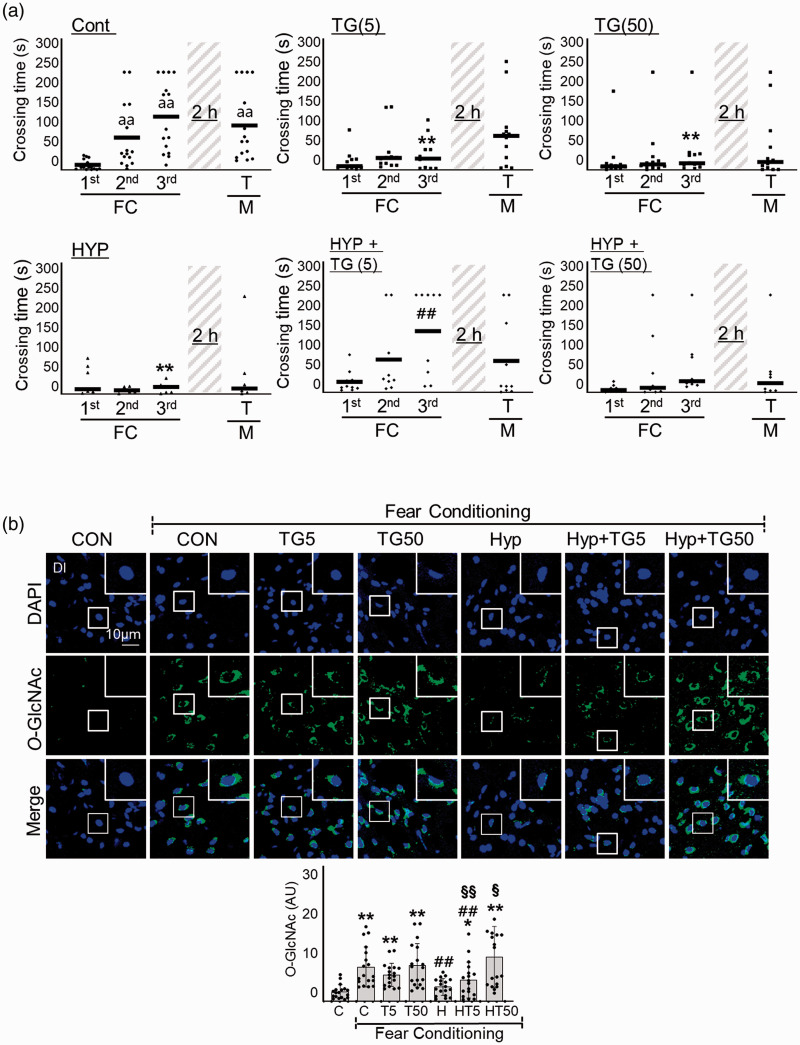
Figure 5.
Effects of Thiamet-G on RH-induced L/M dysfunction. Thiamet G (TG, 5 or 50 ng/g) was intraperitoneally injected to zebrafish 2 h prior to each bout of hypoxia during RH (HYP). (a) L/M functions were measured by fear context passive avoidance test. Dots indicate the individual crossing time and bars represent the mean crossing time (n=7–12/group). Data analysis within a group, repeated measures nonparametric ANOVA (Friedman’s test) with FDR was used for multiple comparisons (aap<0.01 vs. the 1st FC of Con). Analysis between groups, two-way ANOVA followed by Turkey multiple comparisons test was performed (**p<0.01 vs. Con, ##p<0.01 vs. Hyp). (b) Representative confocal images (x40) of DAPI (blue), O-GlcNAc (green), and merged immunofluorescence staining of the telencephalon Dl region of zebrafish brain at 6 h of FC. Enlarged images are presented in the white boxes. Graphs represent densitometric quantification of O-GlcNAc (n=6/group). Statistical analysis was carried out by Kruskal-Wallis with false discovery rate (FDR) multiple comparison test. (**p<0.01 vs. Cont, ##p<0.01 vs. fear-conditioned Cont, §p<0.05, §§p<0.01 vs. fear-conditioned RH.)

