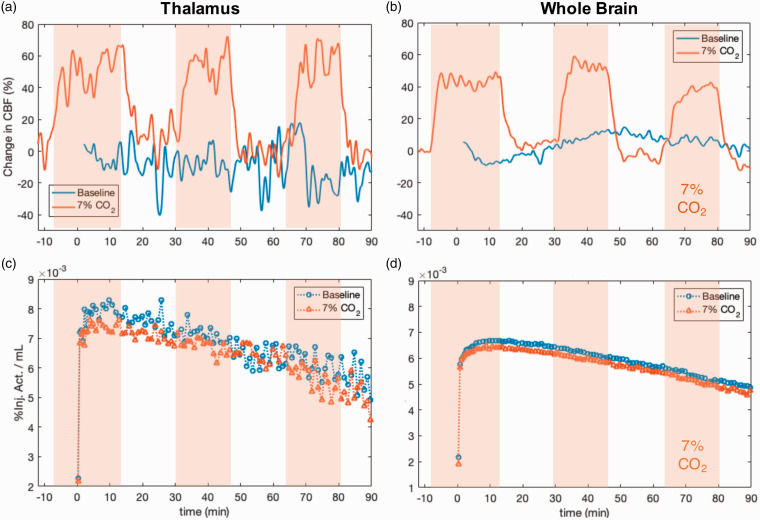
Figure 3.
(a, b): Relative cerebral blood flow changes (CBF) as measured with pCASL (smoothed with a Gaussian kernel across 16 points) from two experimental sessions that include baseline and hypercapnia conditions from one representative animal. Hypercapnia periods (delineated as orange shaded areas) clearly show increased CBF (orange line) compared to a baseline scan without hypercapnia (blue line), both in the thalamus and across whole brain. (c, d): Corresponding, simultaneously acquired, time activity curves (TACs) from two bolus injections of [11C]PBR28, shown for the thalamus and the whole brain. The baseline TACs (blue circles) and the TACs with hypercapnia intervention (orange triangles) are similar in magnitude and shape, with no detectable changes observed despite the increased CBF.

