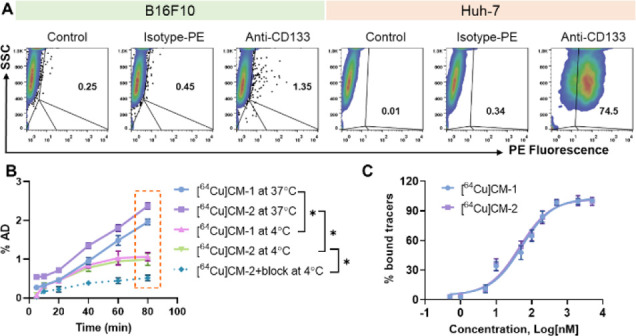
Figure 2.

(A) Flow cytometry analysis of the levels of CD133 protein in different cancer cell lines. PE: phycoerythrin; SSC: side-scatter; the cells gated in the upper right panels were assigned as CD133-positive cells, and their proportions are indicated in the panels (number in black %). (B) Cellular uptake of [64Cu]CM-2 in Huh-7 cells at 4 or 37 °C. The block study was performed using antiCD133 (0.1 mg/mL) as a blocking agent. Statistical analysis was performed for 80 min uptakes using two-way ANOVA, followed by Bonferroni’s multiple comparisons test, n = 3, *P < 0.05. (C) Saturation binding curves of [64Cu]CM-1 and [64Cu]CM-2 determined using a Huh-7 cell-based assay.
