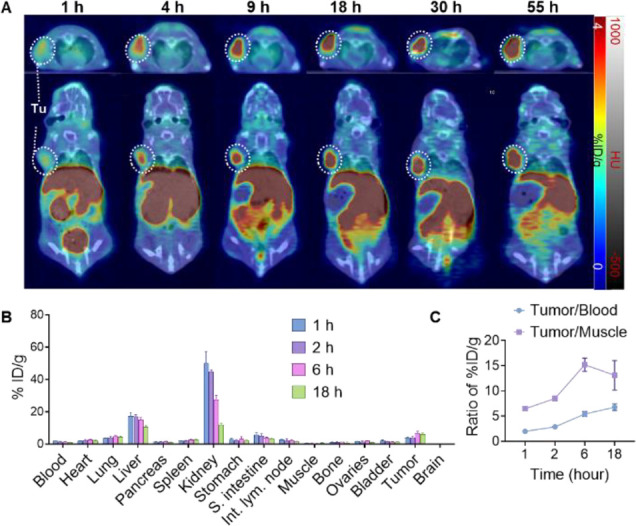
Figure 3.

(A) Series of coregistered sectional PET-CT images of Huh-7 tumor-bearing BALB/C nude mice at different time points p.i. of [64Cu]CM-2 (17 MBq/mouse, 0.2 mL, ∼0.5 nmol of CM-2). Upper panels: axial view; lower panels: coronal view. White dashed circles indicate Huh-7 tumors. (B) Ex vivo biodistribution of [64Cu]CM-2 in major organs at different time points after i.v. injection (3.7 MBq per mouse, 0.1 mL, ∼0.1 nmol of CM-2). S. intestine: small intestine; Int. lym. node: intestine lymph node. Data represent means ± SD, n = 3 for each point. (C) Uptake ratios of tumor to blood (T/B) and tumor to muscle (T/M) calculated from the ex vivo biodistribution data. Data represent means ± SD, n = 3.
