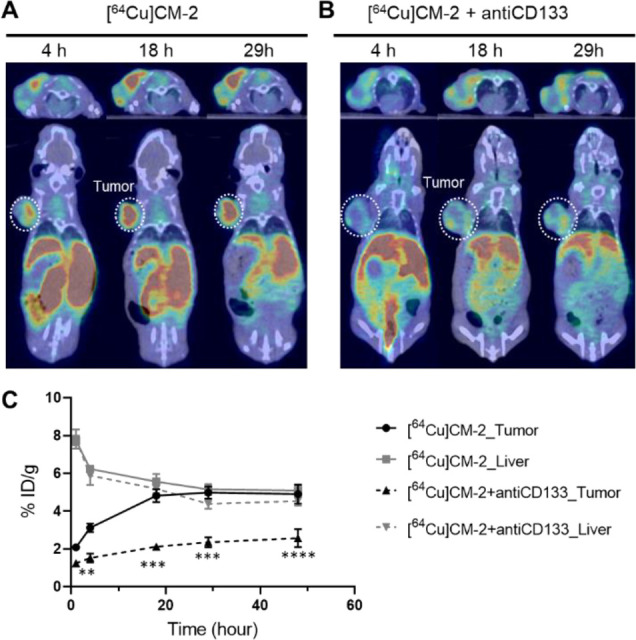
Figure 4.

A blocking PET study to verify the specificity of the tracer. Series of coregistered sectional PET-CT images of Huh-7 tumor-bearing BALB/C nude mice at different time points p.i. of (A) [64Cu]CM-2 (18.5 MBq/mouse, 0.2 mL, ∼0.5 nmol of CM-2) or (B) [64Cu]CM-2 (18.5 MBq/mouse, 0.2 mL, ∼0.5 nmol of CM-2) + antiCD133 (1 mg/kg, administered 2 min prior to [64Cu]CM-2 injection). Upper panels: axial view; lower panels: coronal view. White dashed circles indicate Huh-7 tumors. (C) Quantification of the % ID/g in the Huh-7 tumor and the liver from panels A and B. Statistical analysis was performed using two-way ANOVA, followed by Bonferroni’s multiple comparisons test, n = 3, **P < 0.01, ***P < 0.001, ****P < 0.0001.
