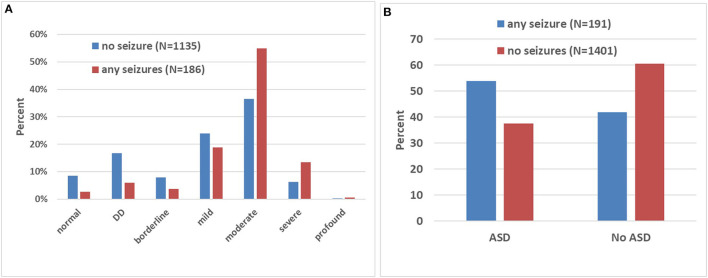
Figure 1.
Association between intellectual disability (ID), autism spectrum disorder (ASD), and seizures in FXS. (A) The bar graph depicts the proportion (in percentages) of individuals with and without seizures at each level of ID. Note the higher proportion of patients with seizures at the higher levels of ID severity. DD corresponds to developmental delay in younger individuals. (B) The graph shows the proportion (in percentages) of individuals with and without seizures diagnosed (or not) with ASD. Note in the group with ASD, a higher proportion of patients with seizures.

