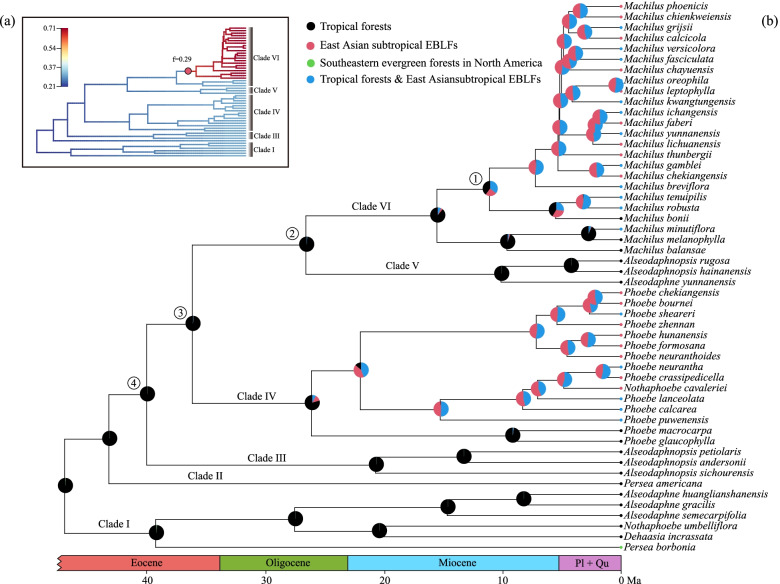
Fig. 2.
Combined diversification rate analyses and ancestral habitat reconstruction of tribe Perseeae. (a) Phylorate inferred from BAMM analysis with “ExpectedNumberofShifts” set to 1 and global sampling probability set to 0.135. (b) Ancestral habitat reconstructed by R package phytools with SYM model. Speciation rates (lineages per million years) are color-coded on branches in (a). Red circles in (a) indicates the position of speciation rate shift. Numbers in the circles near the nodes in (b) correspond to those node numbers listed in the main text and Fig. S11. The pie charts at the nodes represent the posterior probabilities of ancestral habitat types. Dated phylogeny of tribe Perseeae is derived from Fig. S11. Pl and Qu are abbreviations for Pliocene and Quaternary, respectively

