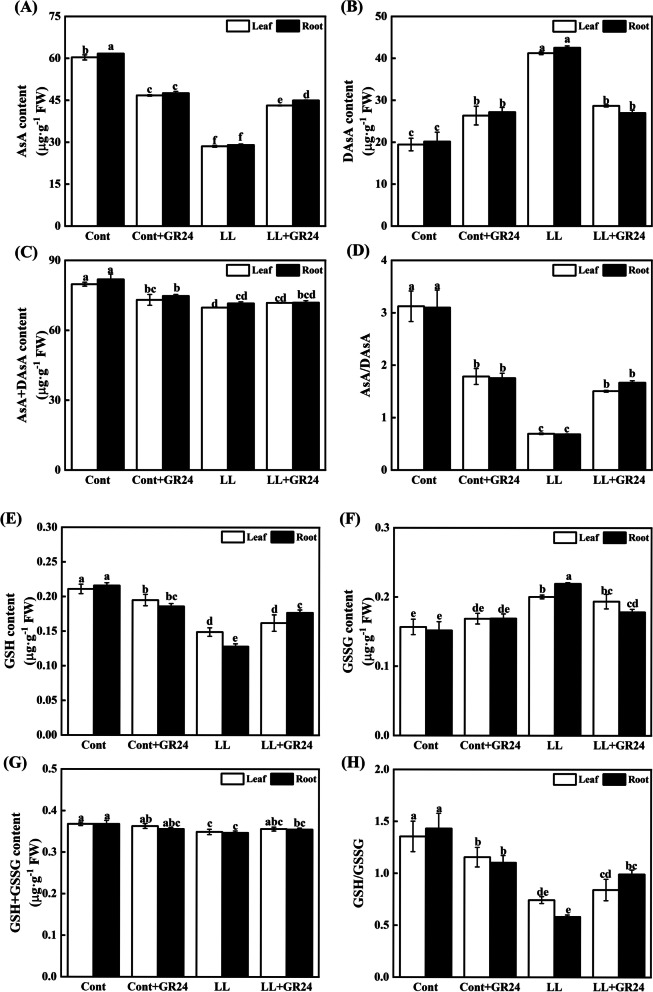
Fig. 9.
Effects of GR24 treatment on AsA(A), DAsA(B), and AsA + DAsA contents (C), the AsA/DAsA ratio (D), GSH(E), GSSG(F), and GSH + GSSG(G) contents and the GSH/GSSG ratio (H) in cucumber seedlings under low light stress. Note: The respective parameters were measured at 7 days after the start of low light stress and/or 10 μM GR24 treatments. Each histogram represents the mean value of three independent experiments, and the vertical bars indicate SEs (n = 3). Different letters indicate significant differences at P < 0.05, according to Duncan’s multiple range tests. Cont, 0 μM GR24 + 500 μmolm− 2 s− 1 PPFD; Cont+GR24, 10 μM GR24 + 500 μmolm− 2 s− 1 PPFD; LL, 0 μM GR24 + 60 μmolm− 2 s− 1 PPFD; LL + GR24, 10 μM GR24 + 60 μmolm− 2 s− 1 PPFD. Here, AsA, reduced ascorbate; DAsA, oxidized ascorbate; GSH, reduced glutathione; GSSG, oxidized glutathione

