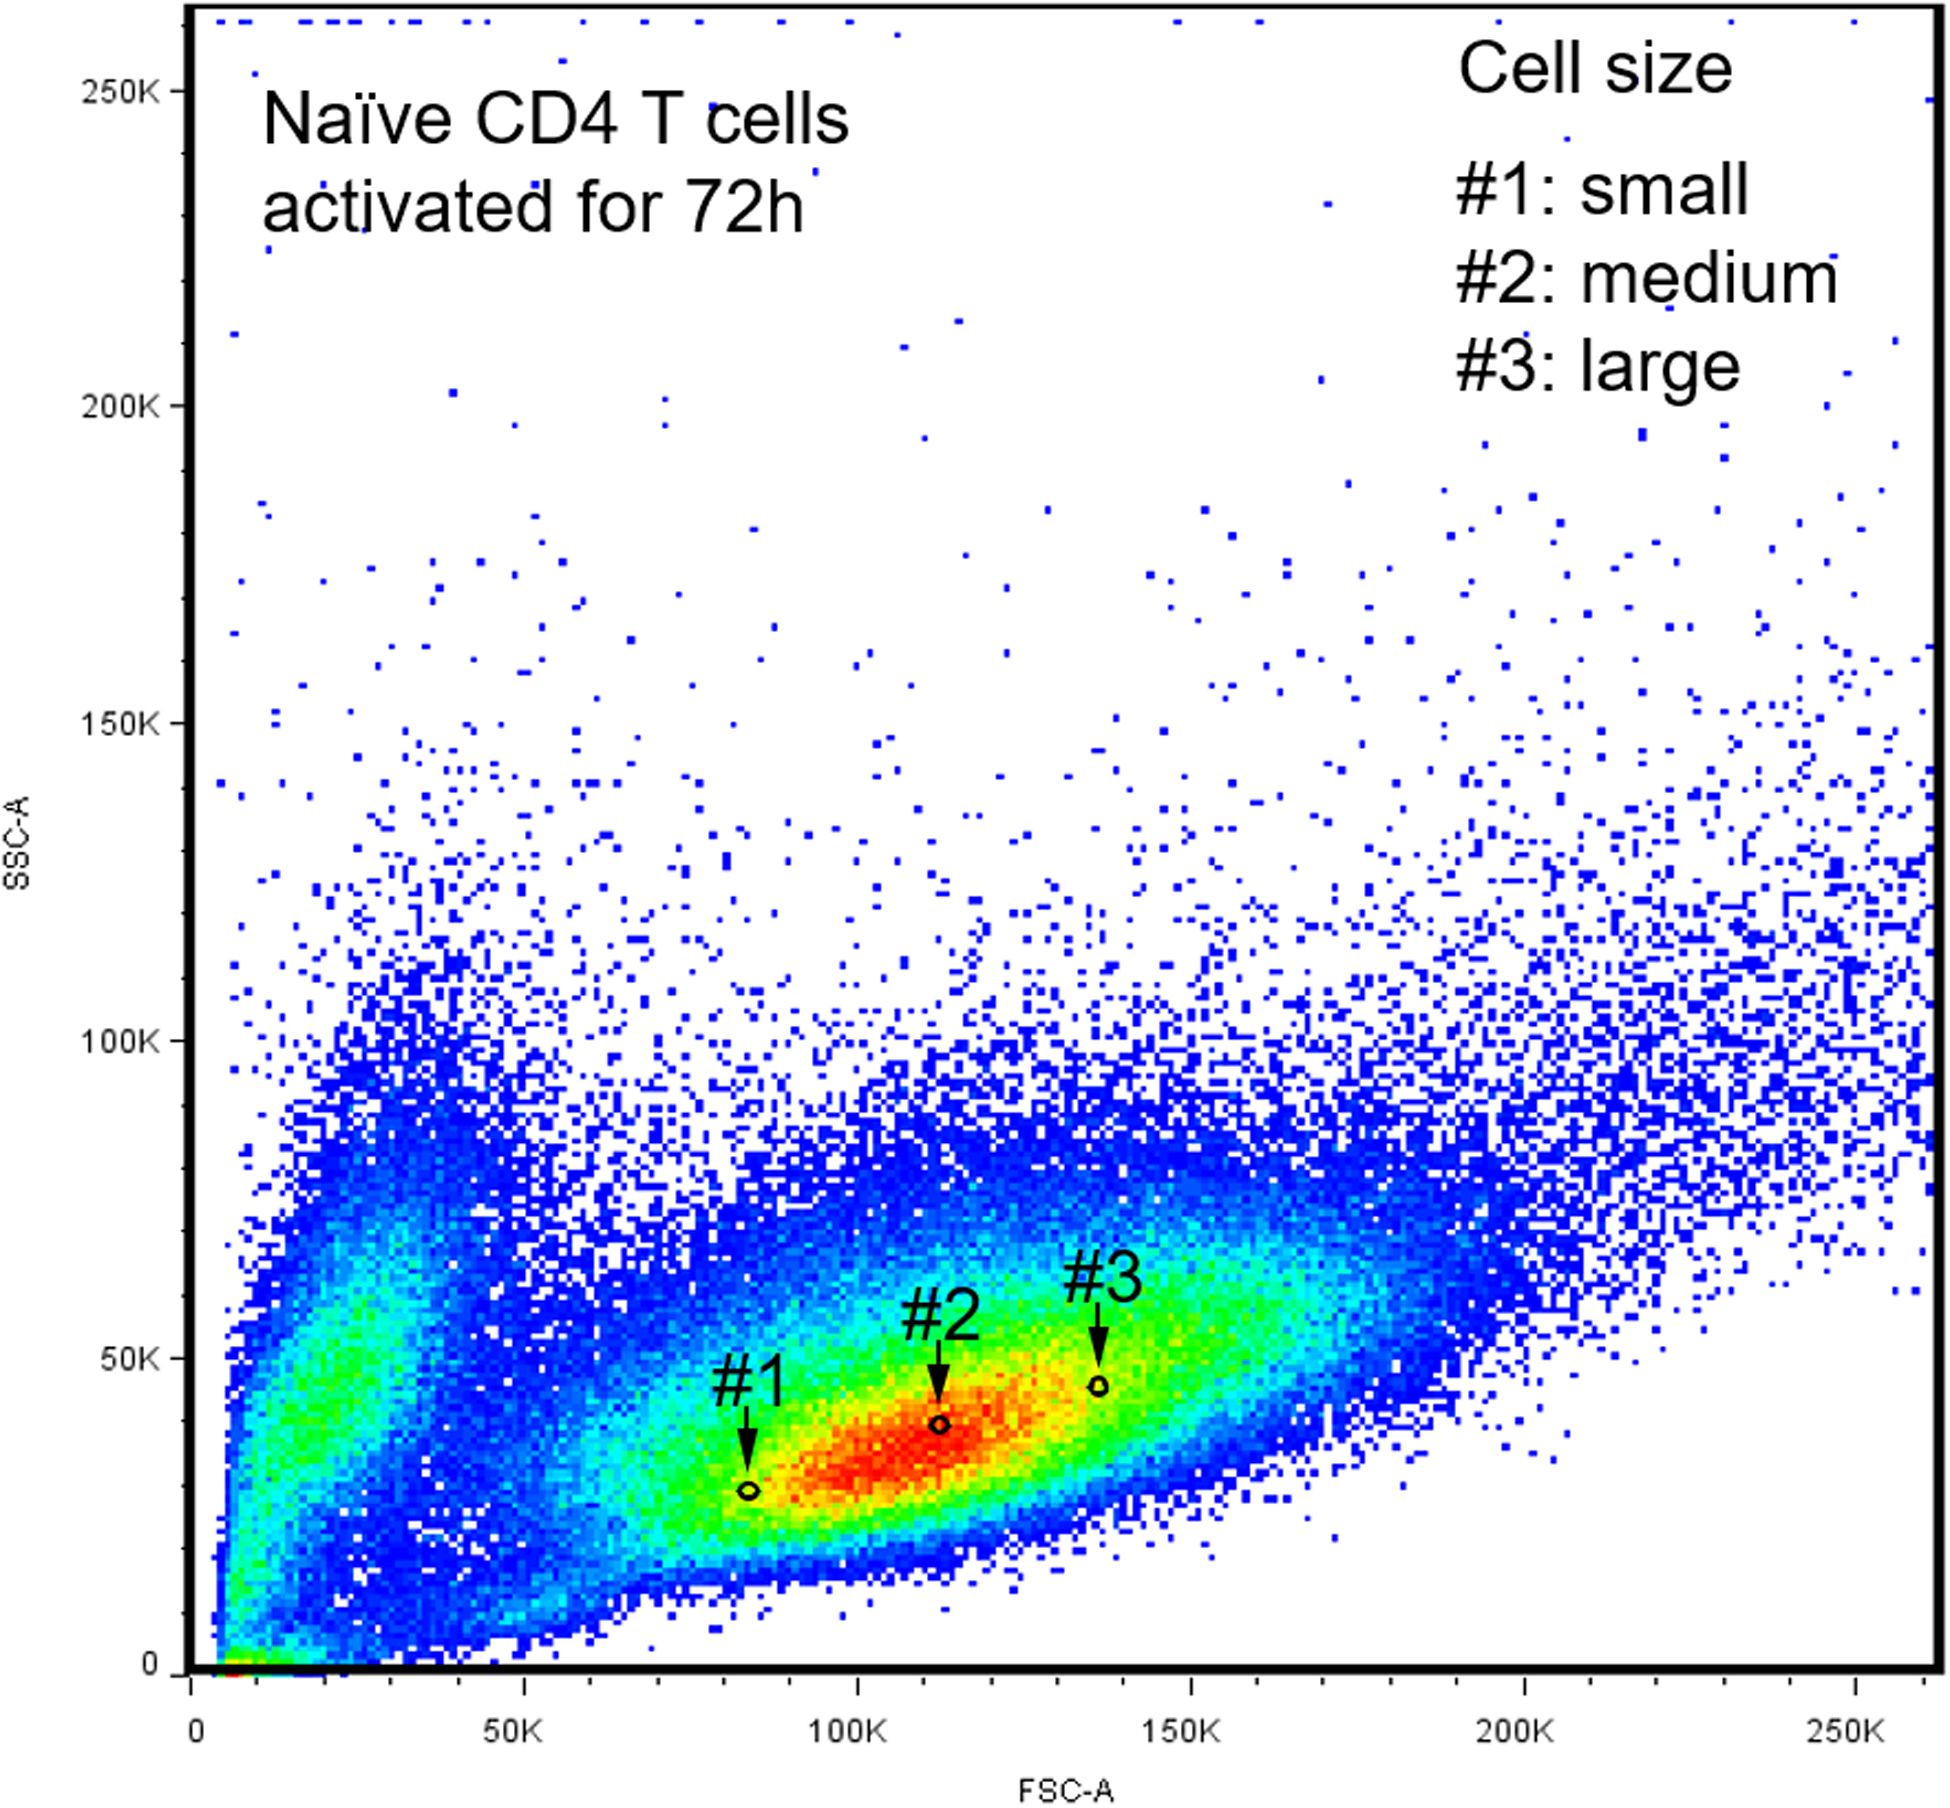
Extended Figure 2.

CD4+CD45RA+ T cells were stimulated for 72 h. ER biomass was determined with ER tracker and mitochondrial function was assessed with the mitochondrial membrane potential. Gate #1: small cellular size. Gate #2: medium cellular size. Gate #3: large cellular size.
