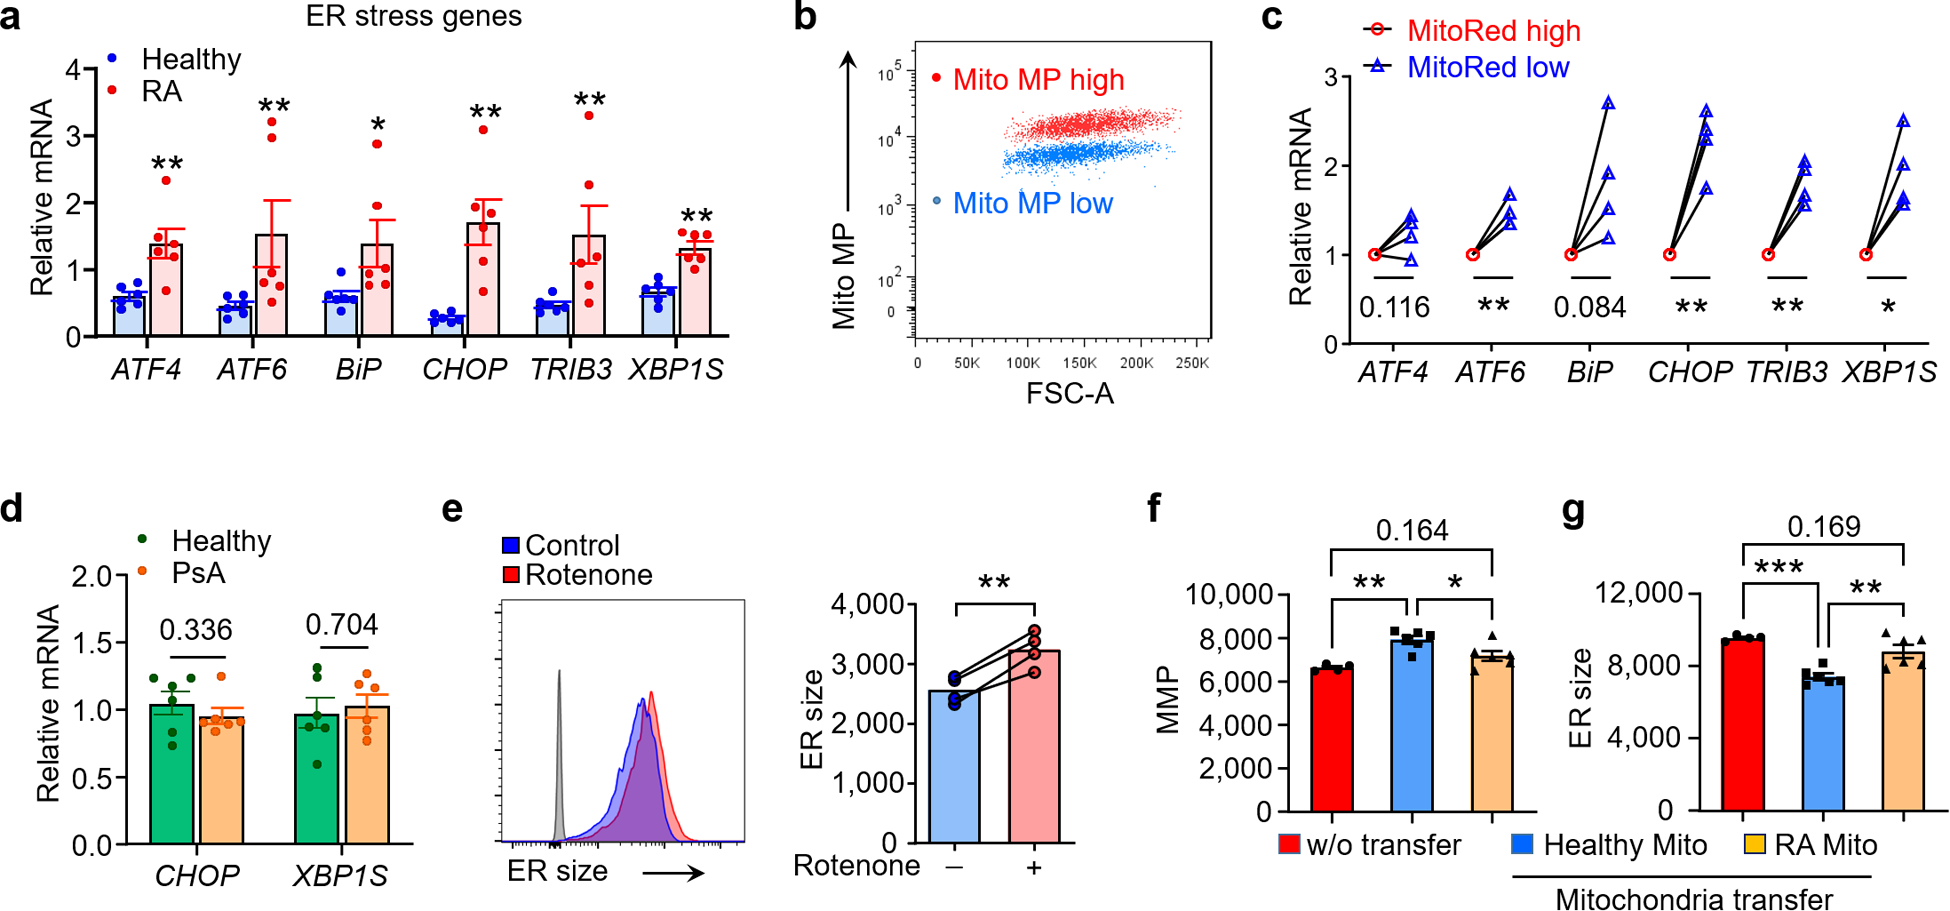
Fig. 2. Mitochondrial insufficiency promotes ER expansion.

(a) ER stress gene expression (qPCR) in healthy and RA T cells (Healthy: n=6; RA: n =6). (b, c) Separation of two CD4+ T cell subpopulations based on mitochondrial membrane potential and qPCR analysis of ER stress genes in Mito MPhi and Mito MPlo T cells, n=4. (d) Comparison of CHOP, XBP1S mRNA level in healthy and PsA T cells, n=6. (e) Mitochondrial stress expands ER size. Healthy naïve T cells were activated for 72 h with or w/o the complex I inhibitor Rotenone (10nM). Histogram of ER Tracker staining and collective MFI, n=4. (f, g) Mitochondrial transfer corrects ER size. CD4+CD45RA+ T cells from RA patients were stimulated with anti-CD3/CD28 for 48 h. mitochondria isolated from healthy or RA CD4+ T cells were transferred into RA T cells (donor cell number/recipient cell number=10:1). Mitochondrial membrane potential (f) and ER size (g) in RA T cells after mitochondria transfer, n = 6. All data are mean ± SEM. Two-tailed unpaired Mann-Whitney-Wilcoxon rank test (a, d). Two-tailed paired t test (c, e). One-way ANOVA and post-ANOVA pair-wise two-group comparisons conducted with Tukey’s method (f, g). *P < 0.05, **P < 0.01, ***P < 0.001.
