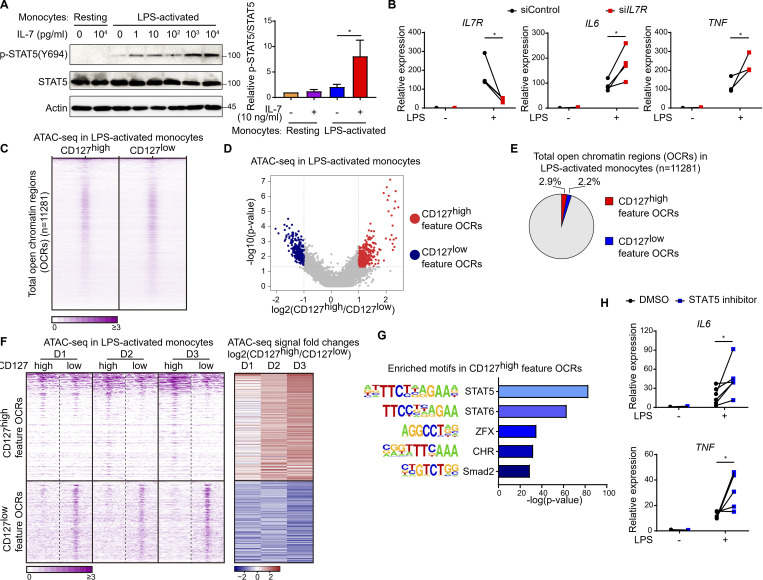
Figure 4.
CD127–STAT5 axis constrains inflammatory gene expression in human monocytes. (A) CD14+ monocytes were pretreated with or without LPS for 6 h, followed by various doses of human IL-7 (from 1 pg/ml to 10 ng/ml) for 30 min. STAT5 activation was detected by Western blotting. β-Actin was used as a loading control. One representative result from three independent experiments is shown (left). The protein level of p-STAT5(Y694) was quantified by densitometry, normalized to total STAT5 protein, and expressed relative to untreated (without LPS and IL-7) sample (right). *, P < 0.05; paired t test. Data are shown as the mean ± SD of three independent experiments. (B) CD14+ monocytes were transfected with negative control or IL7R-specific siRNA (siControl or siIL7R). 2 d after transfection, cells were stimulated with LPS (10 ng/ml) for 3 h, and mRNA of IL7R, IL6, and TNF were measured by qPCR. Relative expression was normalized to an internal control (GAPDH) and expressed relative to LPS untreated siControl sample. *, P < 0.05; paired t test. Each pair of data points indicates an independent experiment. IL7R, n = 4; IL6, n = 4; TNF, n = 3. (C) With CD127-based FACS sorting for 6-h LPS-treated monocytes, ATAC-seq datasets were generated for CD127high and C127low monocytes from three donors separately. Heat maps of pooled ATAC-seq signals around the total identified OCRs were shown in CD127high and C127low monocytes. Each row indicates one OCR, and the rows were sorted by the decreasing ATAC-seq signals in OCRs. (D) Volcano plot shows the differentially opened OCRs by ATAC-seq between CD127high and CD127low monocytes (P < 0.05; fold change ≥2 or ≤0.5). Highly opened OCRs in CD127high population (CD127high feature OCRs) and highly opened OCRs in CD127low population (CD127low feature OCRs) are indicated in red and in blue, respectively. Fold changes are shown as the mean value of CD127high/CD127low ratio from three donors. (E) Pie graph shows the percentages of CD127high and C127low feature OCRs in total identified OCRs in LPS-activated monocytes. (F) Heat maps (left) show the ATAC-seq signals around the CD127high feature and CD127low feature OCRs in each pair of CD127high and CD127low monocytes from three donors and corresponding ATAC-seq signal fold changes (CD127high/CD127low; right) were log2 transformed and expressed by color from blue (negative) to red (positive). (G) Top five results from motif enrichment analysis in CD127high monocyte featured OCRs are shown according to the decreasing −log10(P value) for enriched motifs. P value by binomial distribution. (H) CD14+ monocytes were pretreated with STAT5 inhibitor (100 µM) for 2 h and then were stimulated with LPS (10 ng/ml). mRNA levels of IL6 (LPS 6 h) and TNF (LPS 3 h) were measured using qPCR. *, P < 0.05 by paired t test. Each pair of data points represents an independent experiment (n = 6). Independent experiments in A, B, and H were performed with cells from one healthy donor for each experiment.

