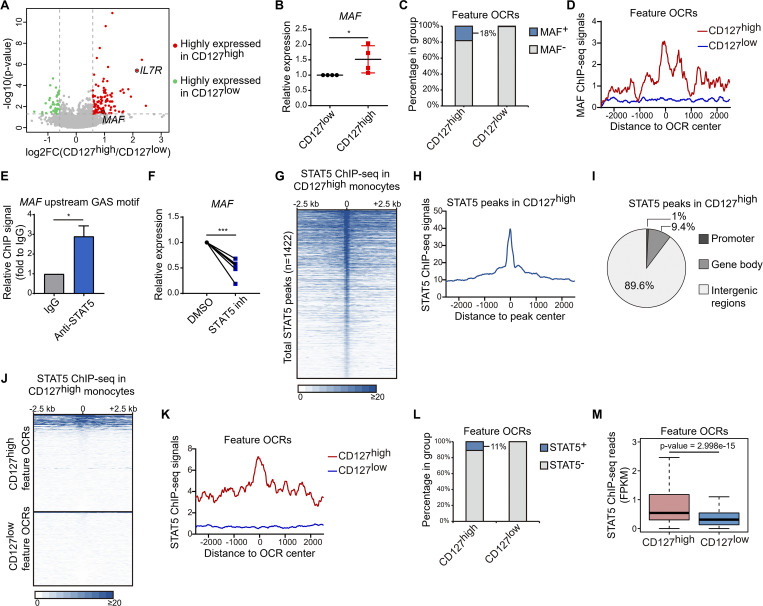
Figure 5.
STAT5 reinforces unique epigenetic landscape in CD127high monocytes to impose hypoinflammatory phenotype. (A) RNA-seq separately performed in CD127high and CD127low populations from LPS 6-h stimulated CD14+ monocytes of three healthy donors. Volcano plot shows the significant differential expression between CD127high and CD127low populations (P < 0.05; fold change ≥1.5 or ≤0.67). Highly expressed genes in CD127high population and CD127low population are colored in red and in green, respectively. Two CD127high highly expressed genes, IL7R and MAF, were labeled. Fold changes (FCs) are shown as mean value of CD127high/CD127low ratio from three donors. (B) mRNA of MAF in CD127high and CD127low populations from LPS 6-h stimulated CD14+ monocytes was measured by qPCR. Relative expression was normalized to internal control (GAPDH) and expressed relative to CD127low sample. *, P < 0.05 by paired t test. Data are shown as the mean ± SD of four independent experiments. (C) Cumulative percentage plot shows the portions of CD127high and CD127low feature OCRs with significant MAF enrichment (MAF+) in resting human monocytes. (D) Average MAF ChIP-seq signals in resting human monocytes are shown around the CD127high and CD127low feature OCRs. (E) The occupancy of STAT5 in the MAF upstream GAS motif was assessed by ChIP-qPCR in LPS 6-h stimulated THP-1 cells. Relative STAT5 ChIP signals were expressed relative to IgG ChIP negative control sample. *, P < 0.05 by paired t test. Data are shown as the mean ± SD of three independent experiments. (F) CD14+ monocytes were pretreated with STAT5 inhibitor (100 µM) for 2 h and then were stimulated with LPS (10 ng/ml) for 6 h. mRNA of MAF was measured by qPCR. Relative expression is normalized to internal control (GAPDH) and expressed relative to DMSO-treated sample. ***, P < 0.001 by paired t test. Results from six independent experiments are shown. (G) Heat map showing the STAT5 ChIP-seq signals around each identified STAT5 peak in CD127high monocytes by each row. The rows were sorted by decreasing STAT5 ChIP-seq signals in peak regions. (H) Average STAT5 ChIP-seq signals in CD127high monocytes are shown around total STAT5 peak regions. (I) Pie graph shows the genomic distribution of STAT5 peaks in CD127high monocytes. (J) Heat map shows the STAT5 ChIP-seq signals in CD127high monocytes around the CD127high and CD127low feature OCRs. (K) Average STAT5 ChIP-seq signals in CD127high monocytes are shown around the CD127high and CD127low feature OCRs. (L) Cumulative percentage plot showing the portions of CD127high and CD127low feature OCRs with significant STAT5 enrichment (STAT5+) in CD127high monocytes. (M) STAT5 ChIP-seq signals in CD127high and CD127low feature OCRs were counted as FPKM and are shown as a box plot. P value was derived by Wilcoxon rank-sum test. Independent experiments in B and D were performed with cells from one healthy donor for each experiment.

