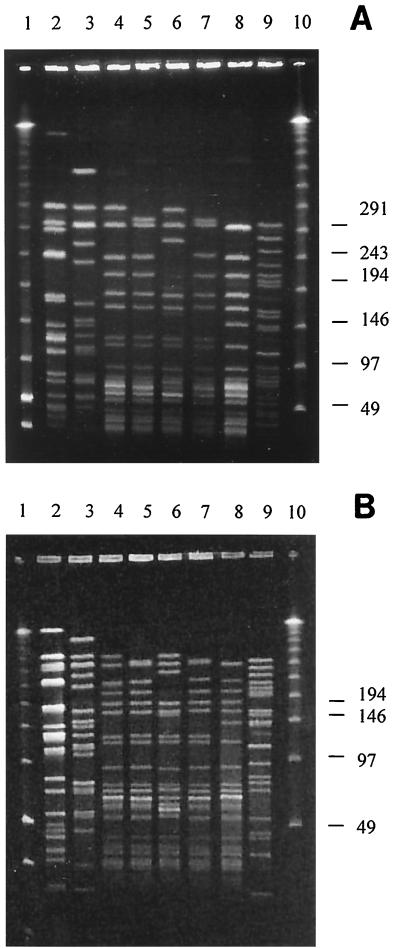
FIG. 1.
PFGE patterns of SmaI-digested DNAs of enterococcal strains. (A) Results obtained using the standard procedure of Murray et al. (21). (B) Results obtained using our procedure. Lane 1, low-range PFGE markers; lanes 2 and 3, E. faecalis strains, including the ATCC strains 29212 (lane 2) and 51299 (lane 3); lanes 4 through 9, E. faecium strains; lane 10, λ ladder. Molecular sizes are shown in kilobases on the right.

