Figure 2.
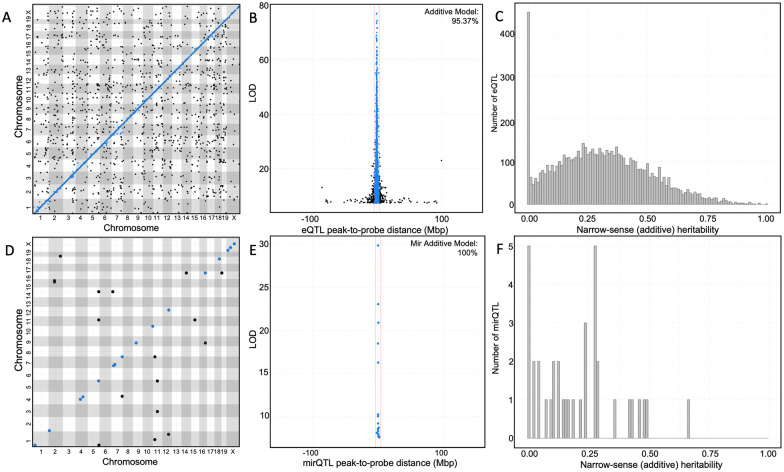
High-resolution hepatic eQTL and mirQTL in Diversity Outbred mice demonstrate complex regulation of expression traits. Results from expression quantitative trait loci (eQTL) analyses using a genome scan model treating the HFCA diet and HP diet groups as an additive covariate. (A) An eQTL plot visualizes all significant associations between gene expression and structural SNP variants from a genome scan. The absolute genomic positions of the SNP and gene transcript probe set in the mouse genome are shown on the x- and y-axes, respectively. The blue line represents cis-eQTL, positions where gene expression variance is associated with a proximal (±4 Mb) SNP variant. (B) Resolution of cis-eQTL is determined by the distance from the SNP to the transcript probe set (x-axis); resolution across all 6183 eQTL-probe pairs on the same chromosome shows 95.4% of cis-eQTL are within ±4 Mb of their probe set and tend to have highly significant log of the odds scores (LOD, y-axis). Cis-eQTL resolution in the DO population is estimated to be 0.30 Mb. (C) Narrow-sense heritability is calculated for the probe set expression of each significant eQTL in the additive QTL analysis. (D) mirQTL plot of the results from the genome scan of miRNA transcription data with diet as an additive covariate. (E) Resolution of 19 cis-mirQTL, showing 89.5% of cis-mirQTL are within ±4 Mb. Cis-mirQTL resolution in the DO population is estimated to be 0.23 Mb. (F) Distribution of narrow-sense heritability for the miRNA expressions with significant mirQTL in the additive genome scan.

