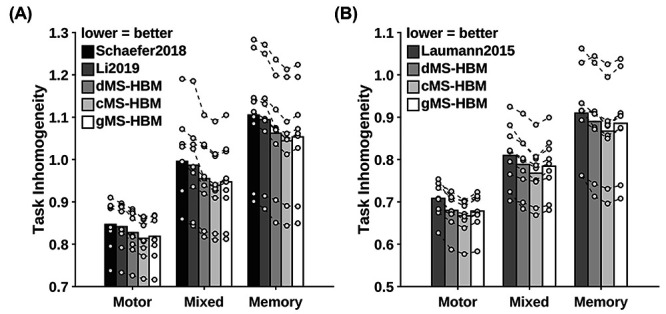
Figure 8 .

MS-HBM parcellations achieved better task inhomogeneity in the MSC dataset. (A) The 400-region individual-specific parcellations were estimated using all resting-state fMRI sessions. Task inhomogeneity was evaluated using task fMRI. Task inhomogeneity was then defined as the SD of task activation within each parcel and then averaged across all parcels and contrasts within each behavioral domain. Lower value indicates better task inhomogeneity. Each circle represents one MSC participant. Dash lines connect the same participants. (B) Same as (A) except that Laumann2015 yielded different number of parcels for each participant, so we matched the number of MS-HBM parcels accordingly for each participant. HCP results are shown in Supplementary Figure S11.
