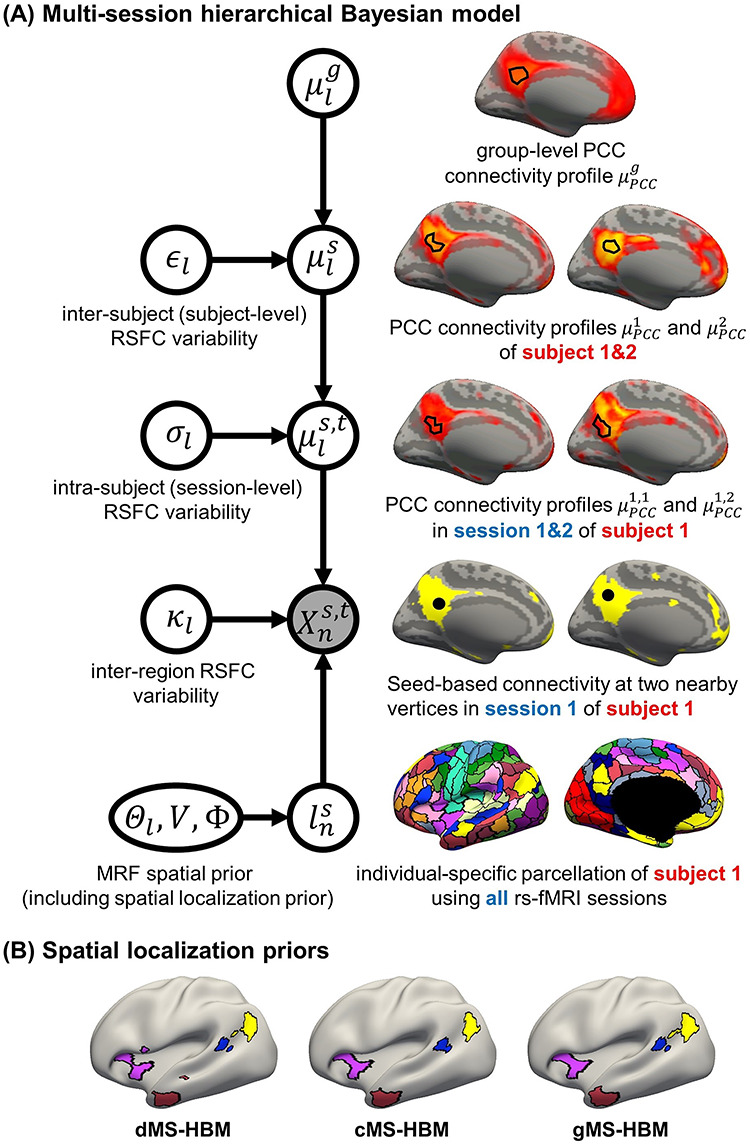
Figure 1 .

(A) MS-HBM of individual-specific areal-level parcellations.  denote the RSFC profile at brain location
  of subject
  during rs-fMRI session
  . The shaded circle indicates that
  are the only observed variables. The goal is to estimate the parcel label
  for subject
  at location
  given RSFC profiles from all sessions.
  is the group-level RSFC profile of parcel
  .
.  is the subject-specific RSFC profile of parcel
  . A large
  indicates small inter-subject RSFC variability, that is, the group-level and subject-specific RSFC profiles are very similar.
  is the subject-specific RSFC profile of parcel
  during session
  . A large
  indicates small intra-subject RSFC variability, that is, the subject-level and session-level RSFC profiles are very similar.
  captures inter-region RSFC variability. A large
  indicates small inter-region variability, that is, two locations from the same parcel exhibit very similar RSFC profiles. Finally,
  captures inter-subject variability in the spatial distribution of parcels, smoothness prior
  encourages parcel labels to be spatially smooth, and the spatial localization prior
  ensures each parcel is spatially localized. The spatial localization prior
  is the crucial difference from the original network-level MS-HBM (Kong et al. 2019). (B) Illustration of three different spatial localization priors. Individual-specific parcellations of the same HCP participant were estimated using dMS-HBM, cMS-HBM, and gMS-HBM. Four parcels depicted in pink, red, blue, and yellow are shown here. All four parcels estimated by dMS-HBM were spatially close together but contained two separate components. All four parcels estimated by cMS-HBM were spatially contiguous. Three parcels (pink, red, and yellow) estimated by gMS-HBM were spatially contiguous, while the blue parcel contained two separate components.
